分子对接—蛋白和小分子对接结果自动可视化
原创

分子对接—蛋白和小分子对接结果自动可视化
之前写过一篇帖子,记录了如何获取蛋白和小分子的分子结构,以及使用autodock进行分子对接。详情见分子对接—蛋白分子和小分子配体,其实后面的第4步:导入pymol中整合以及可视化,其实比较耗时间,而且操作都是一样的。
分子对接的需求断断续续,一个月估计一两个吧。这么久以来,我使用pymol对分子对接的结果进行可视化,都是按照up主的演示,一步步pymol中手动点鼠标操作的,也没想着去优化下流程,就和个牛马一样,哼哧哼哧干活。这两天又有一个分子对接需求,我让chatgpt帮我写了两个脚本,实际调试了几回,代码的运行结果已经和我手动操作出来的结果一摸一样了,这大大节省了时间。
1.前置准备及脚本代码
分子对接总共需要两个文件,一个是蛋白受体文件rep.pdbqt,一个是autodock分子对接结果output.pdbqt。同时把两个脚本文件也放在D:/work/中
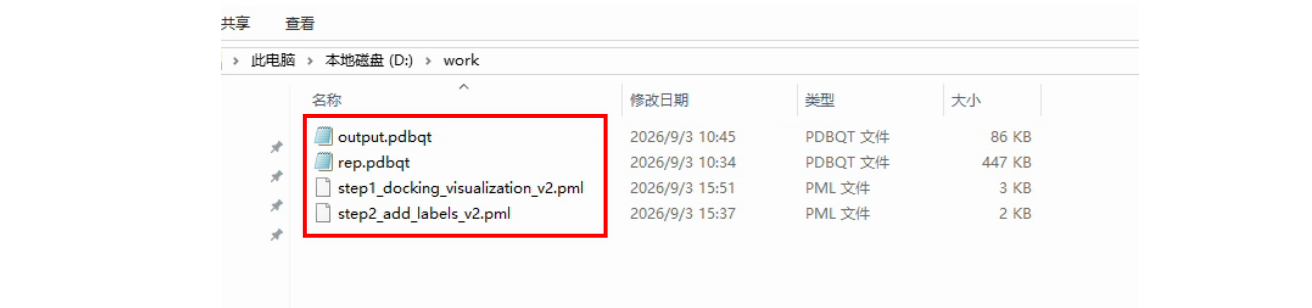
step1_docking_visualization_v2.pml(废弃)
step1_docking_visualization_v3.pml(2026.9.11更新)
# ============================================================
# step1_docking_visualization_v3.pml
# AutoDock Vina docking visualization in PyMOL
# ============================================================

reinitialize

# ---------- 1. Load receptor and ligand ----------
load D:/work/rep.pdbqt, pro
load D:/work/output.pdbqt, lig_all

# Keep only first docking pose / MODEL 1
create lig, lig_all, 1, 1
delete lig_all

# Save combined structure
save D:/work/result.pdb, pro or lig

# ---------- 2. Basic representation ----------
hide everything, all
show cartoon, pro
show sticks, lig

color lightblue, pro
color raspberry, lig

# ---------- 3. Build polar contacts from explicit atom pairs ----------
python
from pymol import cmd
import math

# Clear old objects/selections if rerun
for _name in ["lig_polar_contacts", "contact_atoms", "contact_res"]:
    try:
        cmd.delete(_name)
    except:
        pass

# Find donor/acceptor pairs in both directions
pairs_1 = cmd.find_pairs(
    "lig and donor",
    "pro and acceptor",
    mode=1,
    cutoff=3.6,
    angle=55
)

pairs_2 = cmd.find_pairs(
    "lig and acceptor",
    "pro and donor",
    mode=1,
    cutoff=3.6,
    angle=55
)

pairs = pairs_1 + pairs_2

valid_pairs = []
protein_atoms = []

def get_coord(model_name, atom_index):
    model = cmd.get_model(f"{model_name} and index {atom_index}")
    if not model.atom:
        return None
    return model.atom[0].coord

for pair in pairs:
    (m1, i1), (m2, i2) = pair

    c1 = get_coord(m1, i1)
    c2 = get_coord(m2, i2)

    if c1 is None or c2 is None:
        continue

    d = math.sqrt(
        (c1[0]-c2[0])**2 +
        (c1[1]-c2[1])**2 +
        (c1[2]-c2[2])**2
    )

    # Filter degenerate / impossible contacts
    if d < 1.5 or d > 3.6:
        continue

    valid_pairs.append(((m1, i1), (m2, i2)))

    if m1 == "pro":
        protein_atoms.append(i1)
    elif m2 == "pro":
        protein_atoms.append(i2)

# Create one distance object with all valid contacts
for (m1, i1), (m2, i2) in valid_pairs:
    cmd.distance(
        "lig_polar_contacts",
        f"{m1} and index {i1}",
        f"{m2} and index {i2}"
    )

# Create contact_res from exactly the same protein atoms
protein_atoms = sorted(set(protein_atoms))

if protein_atoms:
    atom_expr = " or ".join(
        [f"(pro and index {i})" for i in protein_atoms]
    )
    cmd.select("contact_atoms", atom_expr)
    cmd.select("contact_res", "byres contact_atoms")
else:
    cmd.select("contact_atoms", "none")
    cmd.select("contact_res", "none")

print("Valid polar-contact pairs:", len(valid_pairs))
python end

# ---------- 4. Style contacts and residues ----------
set dash_color, lightorange, lig_polar_contacts
hide labels, lig_polar_contacts

show sticks, contact_res
color lightorange, contact_res

# ---------- 5. Background ----------
bg_color white

# ---------- 6. Focus ----------
orient pro or lig
zoom lig or contact_res, 8

# ---------- 7. Summary ----------
print "============================================================"
print "Step 1 finished."
print "pro                 = receptor protein"
print "lig                 = Vina MODEL 1 / best pose"
print "lig_polar_contacts  = filtered polar contacts"
print "contact_res         = residues from the SAME contact pairs"
print ""
print "Colors:"
print "  pro          = lightblue"
print "  lig          = raspberry"
print "  contact_res  = lightorange"
print "  contacts     = lightorange"
print ""
print "Combined structure saved to D:/work/result.pdb"
print ""
print "Now manually rotate/zoom and export Figure 1."
print "Then run:"
print "  @D:/work/step2_add_labels_v3.pml"
print "============================================================"
step2_add_labels_v2.pml(废弃)
step2_add_labels_v3.pml(2026.9.11更新)
# ============================================================
# step2_add_labels_v3.pml
# Add distance labels and residue labels
# ============================================================

# ---------- 1. Show polar-contact distance labels ----------
show labels, lig_polar_contacts

# One decimal place for distance labels
set label_distance_digits, 1

# Distance-label appearance
set label_size, 16, lig_polar_contacts
set label_color, black, lig_polar_contacts
set label_font_id, 5, lig_polar_contacts

# ---------- 2. Label interacting residues ----------
# Label one CA atom per residue
label contact_res and name CA, resn + resi

# Apply residue-label settings to parent protein object
set label_size, 22, pro
set label_color, black, pro
set label_font_id, 5, pro

# Offset residue labels slightly
set label_position, (1.2, 1.2, 1.2), pro

# ---------- 3. Preserve representation ----------
show cartoon, pro
show sticks, lig
show sticks, contact_res
show dashes, lig_polar_contacts

bg_color white

# ---------- 4. Summary ----------
print "============================================================"
print "Step 2 finished."
print ""
print "Distance label size:"
print "  set label_size, 16, lig_polar_contacts"
print ""
print "Residue label size:"
print "  set label_size, 22, pro"
print ""
print "Distance values: 1 decimal place"
print "Residue labels: GLU166 / HIS163 / etc."
print "============================================================"
2.使用脚本及结果
打开pymol软件直接调用脚本就行了,首先调用第一个脚本
@D:/work/step1_docking_visualization_v3.pml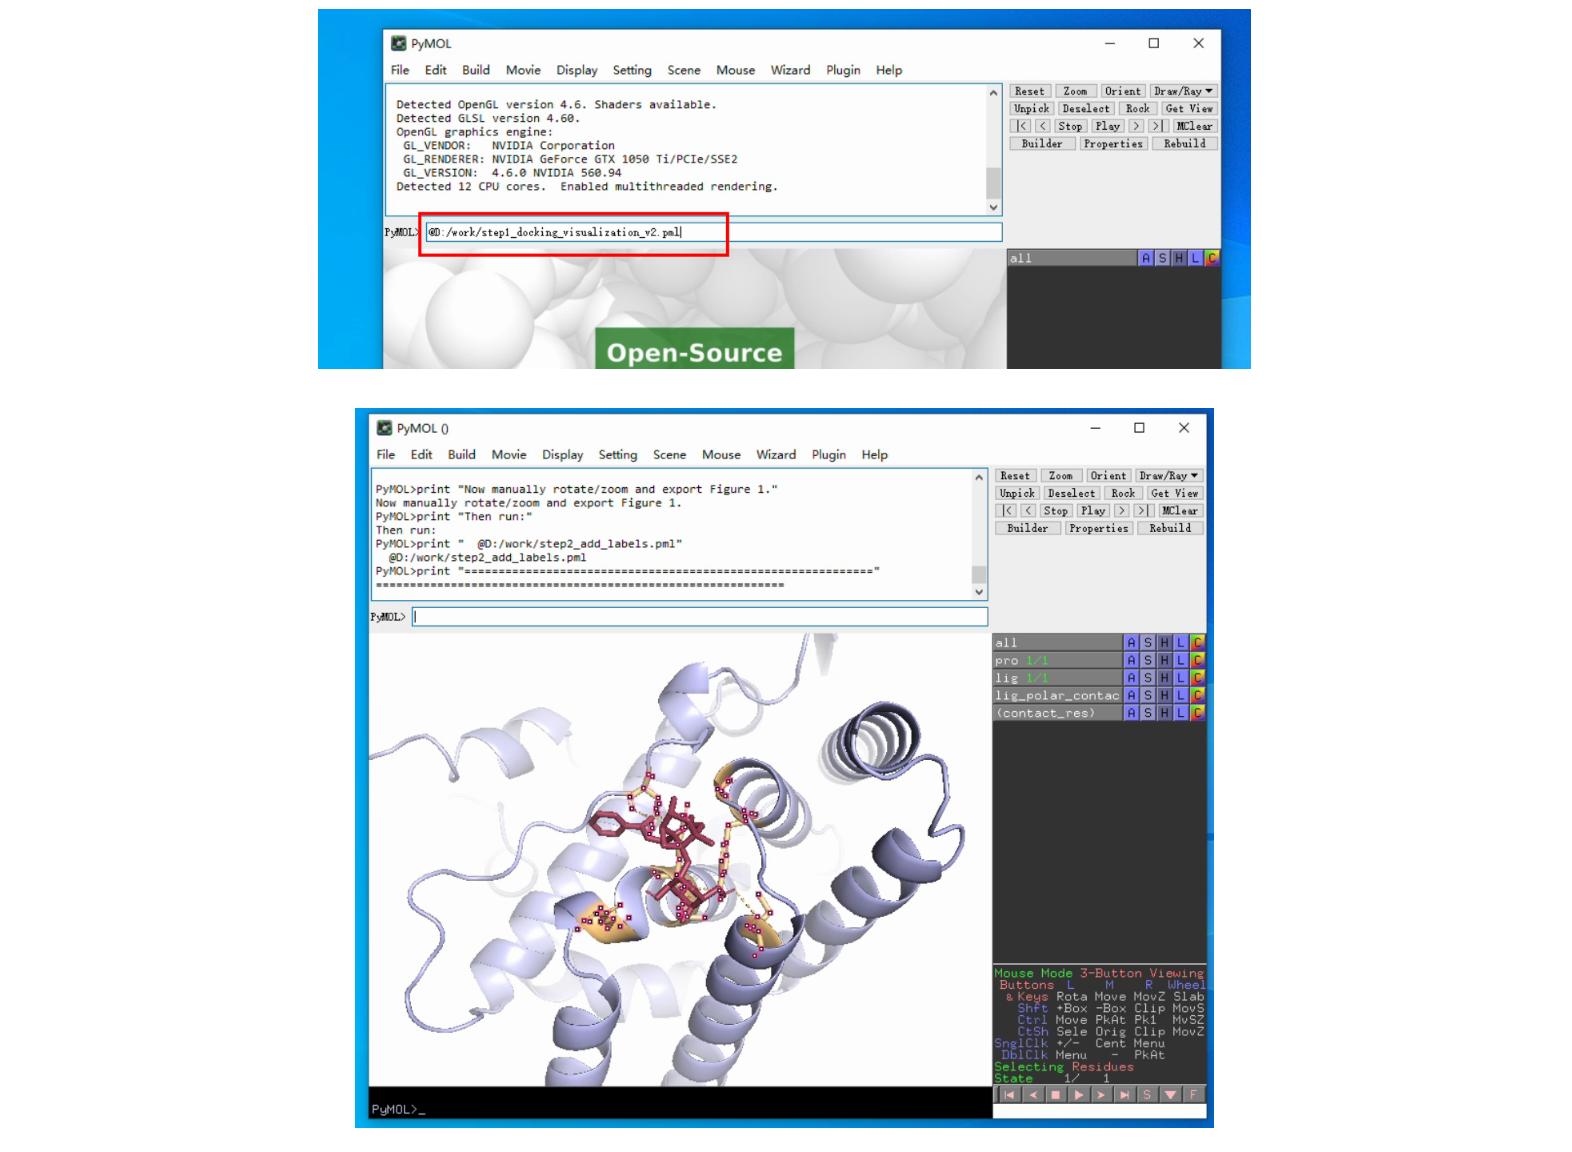
然后pymol中手动调整角度后,Draw/Ray 生成图片导出即可。这就是第一张整体图
随后调用第二个脚本
@D:/work/step2_add_labels_v3.pml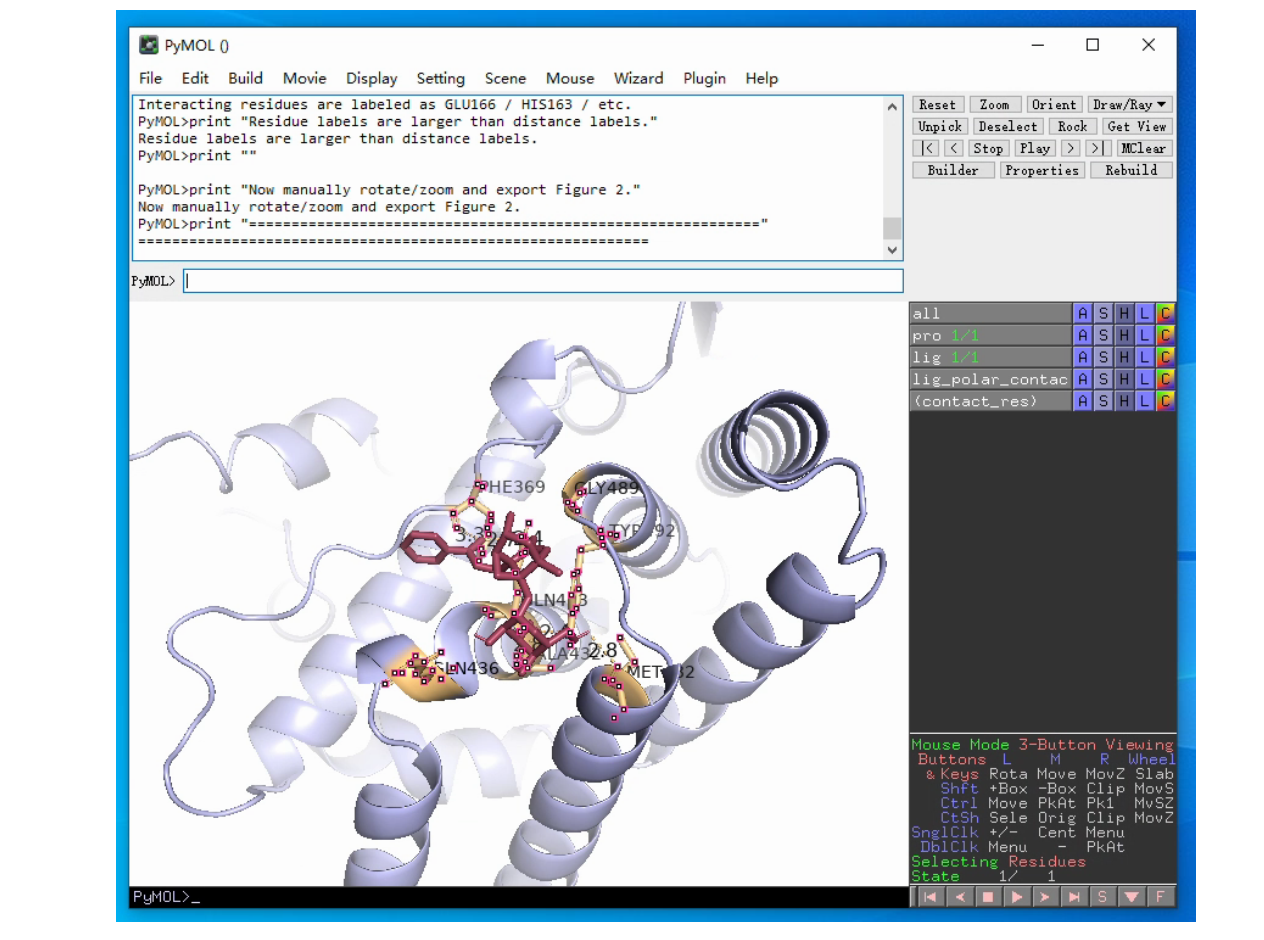
然后pymol中手动调整角度后,Draw/Ray 生成图片导出即可。这就是第二张放大图。
额外说明的是,如果需要手动改氨基酸残基或者氢键大小和字体的话,只需要手动修改step2中这部分代码。
#氢键
set label_size, 16, lig_polar_contacts
#氨基酸
set label_size, 22, pro
还是要优化工作流程啊,原本半个小时到一个小时的工作,现在几分钟就做完了。
原创声明:本文系作者授权腾讯云开发者社区发表,未经许可,不得转载。
如有侵权,请联系 cloudcommunity@tencent.com 删除。
目录
腾讯云开发者

Copyright © 2013 - 2026 Tencent Cloud. All Rights Reserved. 腾讯云 版权所有
深圳市腾讯计算机系统有限公司 ICP备案/许可证号:粤B2-20090059  粤公网安备44030502008569号
腾讯云计算(北京)有限责任公司 京ICP证150476号 | 京ICP备11018762号