98.9% 更快的查询,4倍的索引吞吐量:Elasticsearch 性能系统诊断

98.9% 更快的查询,4倍的索引吞吐量:Elasticsearch 性能系统诊断

点火三周
发布于 2026-07-21 09:16:59
发布于 2026-07-21 09:16:59
98.9% 更快的查询,4倍的索引吞吐量:Elasticsearch 性能系统诊断
三个 Elastic 工具 (AutoOps、Profile API 和 ES Rally) 能够系统地诊断堆栈每一层面的 Elasticsearch 性能问题。在一个物流配送场景中,这些工具揭示了以下问题:分片不平衡导致搜索峰值达到30秒,一个深度分页查询浪费了98.9%的执行时间,以及索引设置将批量摄入吞吐量限制在可实现吞吐量的四分之一。本文将逐一介绍这些工具,它们能揭示什么问题,以及如何利用发现结果来解决问题。
当面对数十个活跃用户连接并使用由 Elasticsearch 集群支持的平台时,快速识别潜在瓶颈并克服它们至关重要。核心问题是:从何开始?以下是您可能的决策路径:
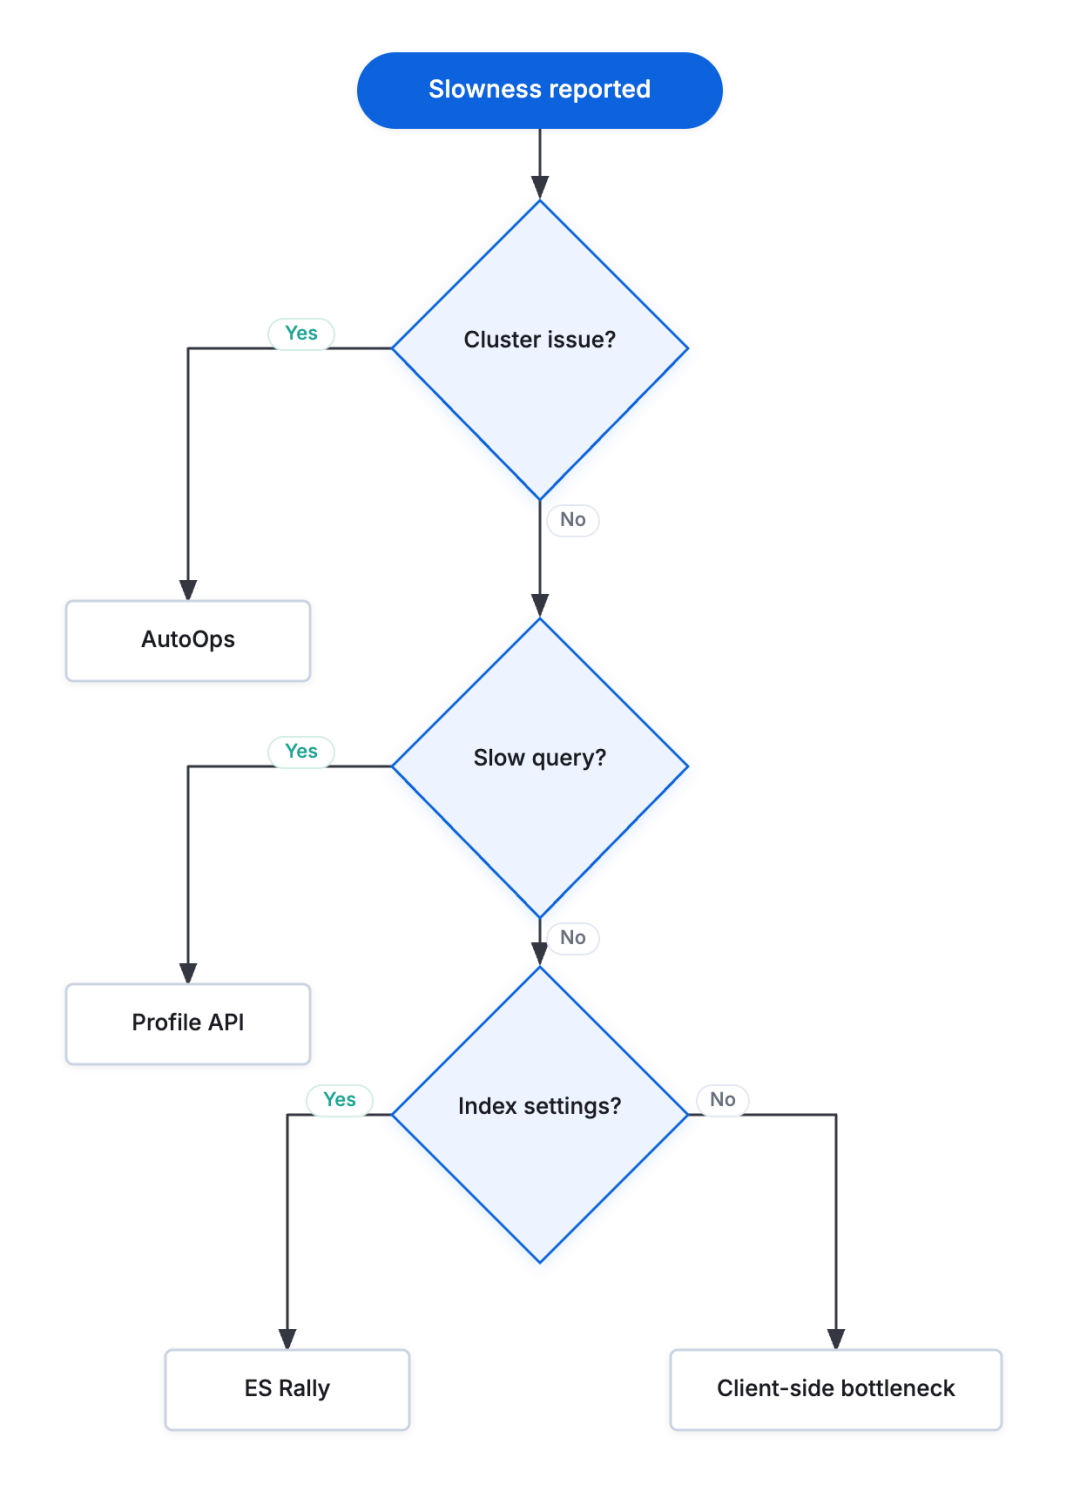
Flowchart showing steps for diagnosing reported slowness. It starts with “Slowness reported” and then branches through decisions labeled “Cluster issue?,” “Slow query?,” and “Index settings?,” leading to boxes for AutoOps, Profile API, ES Rally, and Client-side bottleneck.
Flowchart showing steps for diagnosing reported slowness. It starts with “Slowness reported” and then branches through decisions labeled “Cluster issue?,” “Slow query?,” and “Index settings?,” leading to boxes for AutoOps, Profile API, ES Rally, and Client-side bottleneck.
诊断路径始于 AutoOps,用于检测集群层面的问题,例如资源压力或不合理的分片分布。如果集群健康,Profile API 则有助于识别慢速查询;这些慢速查询的候选可能来自慢查询日志或应用程序侧的日志。接下来,ES Rally 对可能限制吞吐量的索引设置进行基准测试。如果这三个工具都显示没有问题,那么瓶颈就在客户端。
如何使用 AutoOps 检测集群级性能问题
第一个问题总是相同的:集群本身是问题所在吗?
AutoOps 旨在提供实时集群诊断、量身定制的建议,并帮助您快速改善集群的健康状况。它在 Elastic Cloud 中默认提供,并且最近已作为免费选项添加到自托管配置中。
设置 AutoOps 非常简单,只需不到五分钟就能看到数据流入其提供的全面图表列表。其原理是在您的集群附近安装一个 Elastic Agent,该 Agent 会将报告数据发送回与您的 Elastic Cloud 账户连接的 AutoOps 平台。您可以参考此安装指南。
AutoOps 的优势在于它能即时提供警告和建议,这些信息通过现有集群监控技术很难发现。更实用的是,它还会显示问题的解决方案。
在我们的物流配送场景中,AutoOps 发现了一个解释用户报告的慢速问题:集群中存在严重的负载不平衡。节点 es01 几乎处理了所有流量,而其他三个节点则处于空闲状态,导致搜索延迟飙升至30秒,我们将在下一节的图中看到这一点。
AutoOps 如何揭示节点热点和分片不平衡
AutoOps 的节点性能图表显示,es01 几乎处理了所有索引流量(5.6 文档/秒),而 es02、es03 和 es04 则处于空闲状态。
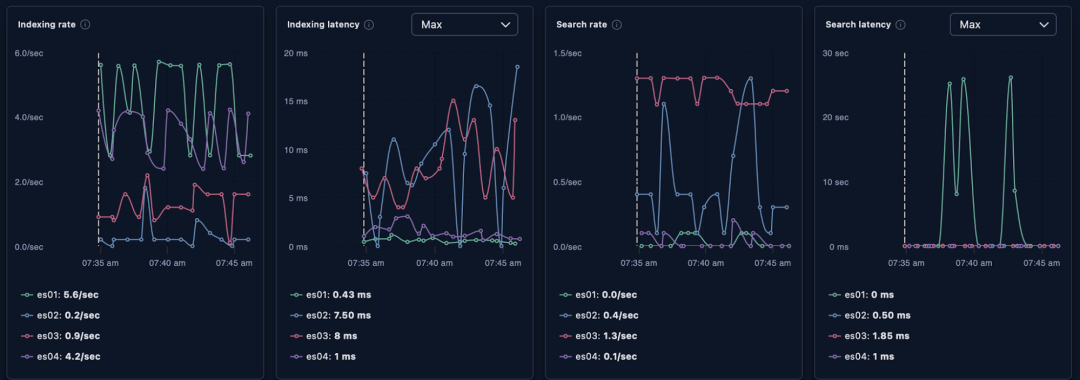
Four line graphs, side by side, showing indexing and search rates and latencies for entities labeled es01, es02, es03, and es04 between 07:35 am and 07:45 am. Each graph has colored lines on a dark background, with legends listing rate and latency values in seconds and milliseconds.
Four line graphs, side by side, showing indexing and search rates and latencies for entities labeled es01, es02, es03, and es04 between 07:35 am and 07:45 am. Each graph has colored lines on a dark background, with legends listing rate and latency values in seconds and milliseconds.
如下图所示,CPU 使用率集中在单个节点 (es01) 上,该节点承载了较重的索引,而其他三个节点大部分时间处于空闲状态。
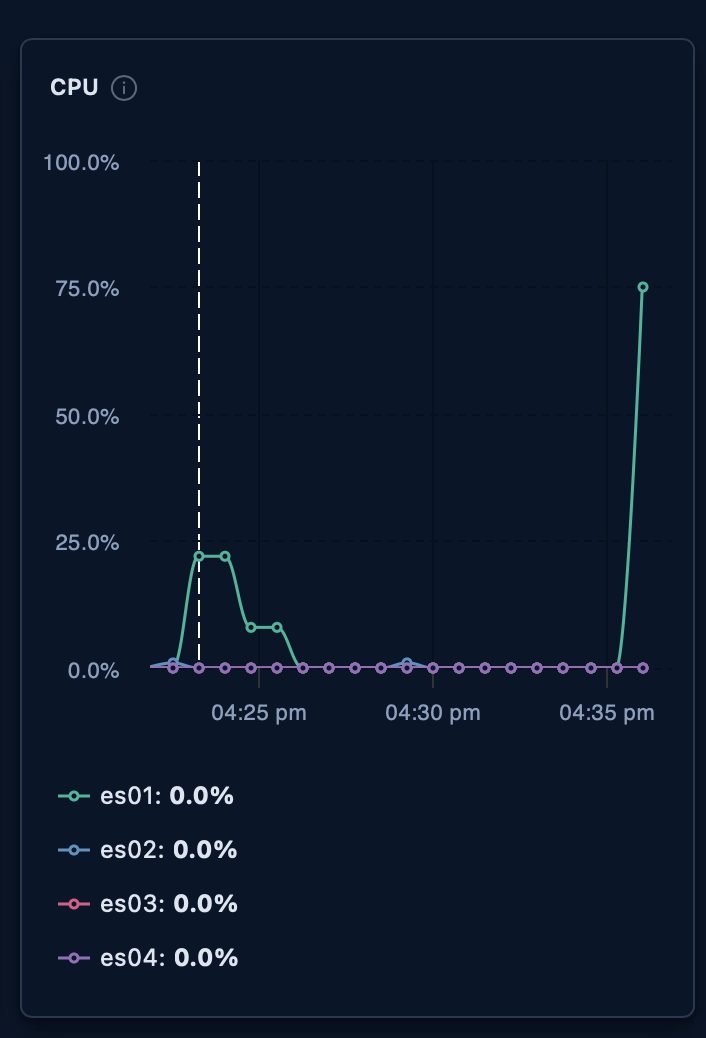
Line graph labeled “CPU,” showing usage percentages for es01, es02, es03, and es04 between 04:25 pm and 04:35 pm. The es01 line rises to about 25% after 04:25 pm, drops near 0%, and then spikes to roughly 75% at 04:35 pm. The other lines remain flat at 0% throughout.
Line graph labeled “CPU,” showing usage percentages for es01, es02, es03, and es04 between 04:25 pm and 04:35 pm. The es01 line rises to about 25% after 04:25 pm, drops near 0%, and then spikes to roughly 75% at 04:35 pm. The other lines remain flat at 0% throughout.
异常行为的下一个信号出现在搜索延迟图表中。通过 AutoOps 的每节点延迟视图,我们发现了一些意想不到的结果。
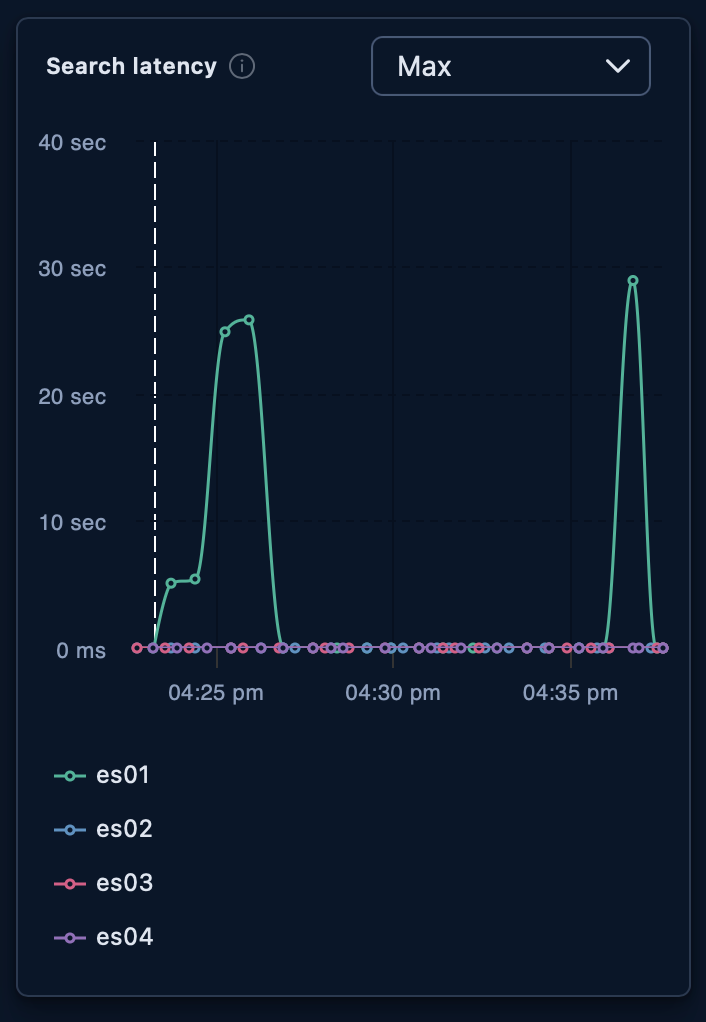
Line graph titled “Search latency” with a dropdown set to “Max.” The vertical axis ranges from 0 ms to 40 sec, and the horizontal axis shows times from 04:25 pm to 04:35 pm. Four lines represent es01, es02, es03, and es04. The es01 line spikes twice to about 30 seconds, while the other three remain flat near 0 ms.
Line graph titled “Search latency” with a dropdown set to “Max.” The vertical axis ranges from 0 ms to 40 sec, and the horizontal axis shows times from 04:25 pm to 04:35 pm. Four lines represent es01, es02, es03, and es04. The es01 line spikes twice to about 30 seconds, while the other three remain flat near 0 ms.
当其他节点没有延迟时,负载较重的节点却表现出影响搜索应用程序的延迟症状。它不仅是一个写入节点,而且还是处理所有搜索请求的节点。在分析过程中,我们发现一个配送索引仅存储在一个节点上,而不是分布在所有四个节点上。这是问题的根本原因。通过重新索引数据(并增加主分片的数量),我们平衡了查询负载,消除了主要问题。
本文仅聚焦于一个 AutoOps 发现,以保持诊断流程的清晰。如需深入了解 AutoOps 揭示的各类问题,请参阅关于热点、高 CPU 使用率和长时间运行查询的专门文章。
如何使用 Profile API 查找慢速 Elasticsearch 查询
一旦集群健康,下一个问题是:是否存在特定且开销大的查询?找到候选查询是第一步。您可以通过 Elasticsearch 的慢查询日志或通过应用程序侧日志(通过测量每个搜索请求所需的时间)来探索它们。在我们的案例中,当用户深入滚动结果时,跟踪配送屏幕上的无限滚动成为了一个问题。
Profile API 是一个强大的工具,用于分析长时间运行的查询并查找搜索瓶颈。入门很简单:只需在您的任何搜索查询中设置 profile="true",响应中就会包含一个带有详细时间分解的 profile 部分。它会突出显示哪个阶段主导了执行时间:查询阶段、聚合阶段还是数据获取阶段。
让我们仔细看看深度分页案例。在一个移动应用程序的无限滚动场景中,用户持续滚动,应用程序通过每次请求获取100个文档来响应。
Vertical interface showing a product list with a search bar labeled “Search products…” and a cart icon. Each entry includes a square placeholder, product name, optional category text, and price. Items listed include prices from $1400 to $1990. A “Show more” button appears at the bottom.
Vertical interface showing a product list with a search bar labeled “Search products…” and a cart icon. Each entry includes a square placeholder, product name, optional category text, and price. Items listed include prices from $1400 to $1990. A “Show more” button appears at the bottom.
随着用户持续滚动,请求可能会达到非常深的分页级别,此时 from 参数会不断增长:
1
2
3
4
5
6
7
8
9
10
11
12
13
14
15
16
17
18
19
20
21
22
23
24
25
26
27
28
29
30
31

GET delivery-records/_search
{
    "profile": true,
    "from": 9000,
    "size": 100,
    "query": {
        "bool": {
            "filter": [
                {
                    "term": {
                        "payment_type": "1"
                    }
                },
                {
                    "range": {
                        "tax_amount": {
                            "gte": 5
                        }
                    }
                }
            ]
        }
    },
    "sort": [
        {
            "delivery_pickup_datetime": {
                "order": "desc"
            }
        }
    ]
}
下面总结并从纳秒转换为毫秒的 profile 数据清晰地表明了瓶颈所在:大部分时间都花费在查询和获取阶段之外的协调工作上,这是由巨大的 from 偏移量引起的。Elasticsearch 必须收集9100个匹配文档,对它们进行排序,丢弃前9000个,然后只返回请求的100个。
Component | Phase | Time |
|---|---|---|
ConstantScoreQuery contains | Query | 34.4ms |
BooleanQuery | Query | 31.1ms |
QueryPhaseCollector contains | Collect | 22.1ms |
SimpleFieldCollector (9,100-doc priority queue) | Collect | 19.1ms |
FetchPhase | Fetch | 12.1ms |
Other steps, like request parsing and deserialization, queue wait time, response building | 1,885.4ms | |
Total | 2,004.2ms |
使用 search_after 修复深度分页问题
在这种情况下,search_after 方法的速度可以提高一倍,因为它避免了扫描和丢弃早期结果。相反,它从第90页返回的最后一个文档开始,使用其 delivery_pickup_datetime 值(以 epoch 毫秒为单位)作为游标,只获取接下来的100条记录。
1
2
3
4
5
6
7
8
9
10
11
12
13
14
15
16
17
18
19
20
21
22
23
24
25
26
27
28
29
30
31
32
33
34

GET delivery-records/_search
{
    "profile": true,
    "size": 100,
    "track_total_hits": false,
    "query": {
        "bool": {
            "filter": [
                {
                    "term": {
                        "payment_type": "1"
                    }
                },
                {
                    "range": {
                        "tax_amount": {
                            "gte": 5
                        }
                    }
                }
            ]
        }
    },
    "sort": [
        {
            "delivery_pickup_datetime": {
                "order": "desc"
            }
        }
    ],
    "search_after": [
        1451604674000
    ]
}
如下面的对比所示,search_after 方法的性能要好得多。
Component | Phase | Time |
|---|---|---|
ConstantScoreQuery contains | Query | 6.8ms |
BooleanQuery | Query | 6.2ms |
QueryPhaseCollector contains | Collect | 2.6ms |
PagingFieldCollector | Collect | 2.0ms |
FetchPhase | Fetch | 2.2ms |
Other steps like request parsing and deserialization, queue wait time, response building | 9.4ms | |
Total | 29.2ms |
性能对比
Component | Deep pagination (from:9000) | search_after | Time saved | % Saved |
|---|---|---|---|---|
ConstantScoreQuery | 34.4ms | 6.8ms | 27.6ms | 80.2% |
BooleanQuery | 31.1ms | 6.2ms | 24.9ms | 80.1% |
QueryPhaseCollector (total) | 22.1ms | 2.6ms | 19.5ms | 88.2% |
FieldCollect | 19.1ms | 2.0ms | 17.1ms | 89.5% |
FetchPhase | 12.1ms | 2.2ms | 9.9ms | 81.8% |
Total | 2,004.2ms | 29.2ms | 1,975ms | 98.5% |
总查询时间从1,004毫秒降至29毫秒(提高了98.5%),这几乎完全是因为 Elasticsearch 不再需要在每个请求中构建并丢弃一个9,000个文档的优先级队列。
如何使用 ES Rally 对 Elasticsearch 索引设置进行基准测试
在集群健康且查询优化完成后,最后一个问题是:索引设置本身是否是瓶颈?
ES Rally 是 Elastic 官方的基准测试工具。它的关键优势在于可复现性:您可以在同一个集群和硬件上,对两种配置运行相同的工作负载,这样结果的任何差异都纯粹归因于您更改的设置。ES Rally 能够在相同条件(相同的集群、硬件和数据集)下衡量改进。
为什么默认的 Elasticsearch 索引设置会限制批量索引吞吐量
在许多情况下,索引缓慢是由于默认索引设置造成的,这些设置适用于开发环境,但不适用于生产环境。例如,默认的 refresh_interval 为1秒会增加资源使用,因为每次 refresh 都会创建一个新的可搜索段;而副本数 (replica count) 为1则会将每个索引请求的写入操作数量增加一倍。
例如,我们的物流配送平台每天批量摄入数千条新记录,这正是这些默认设置会带来负面影响的工作负载类型。将 refresh_interval 设置为 -1 会在批量加载阶段禁用刷新,而临时将副本数降至0则会将写入操作减半。这些设置会在导入完成后恢复。
在这个演示中,我们不会专注于如何准备自定义数据进行基准测试,但值得一提的是,有一篇不错的文章对此进行了介绍。
为了进行基准测试,您需要设置两个文件夹:一个包含当前设置,另一个包含候选设置。本案例中的示例数据集包含100万条记录。下面描述的所有文件都可以在这个仓库中找到。
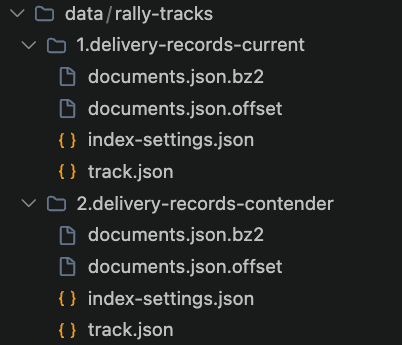
File directory view labeled “rally-tracks,” showing two folders. Each folder contains four files, with icons indicating compressed and JSON file types
File directory view labeled “rally-tracks,” showing two folders. Each folder contains four files, with icons indicating compressed and JSON file types
这两个 track 文件夹都包含一个 index-settings.json 文件。这些文件允许您调整映射、分片计数、副本设置和字段类型;例如,将字段从 double 转换为 scaled_float,或从 text 转换为 keyword。由于 ES Rally track 可以快速重新运行,因此可以轻松地尝试不同的配置,并在迭代过程中评估新的优化思路。
下一步是运行 race 命令(针对当前和候选 race)以收集统计数据。
1
2
3
4
5
6
7
8

esrally race \
  --track-path="delivery-records-current" \  # (当前设置文件夹的名称)
  --target-hosts="es01:9200" \              # (ES 集群的位置)
  --pipeline=benchmark-only \
  --report-format=csv \
  --report-file="current.csv" \
  --race-id="run-current" \
  --on-error=abort
1
2
3
4
5
6
7
8

esrally race \
  --track-path="delivery-records-contander" \
  --target-hosts="es01:9200" \
  --pipeline=benchmark-only \
  --report-format=csv \
  --report-file="contander.csv" \
  --race-id="run-contander" \
  --on-error=abort
快速提示:使用有意义的 --race-id 值(而不是自动生成的)可以使比较命令更容易运行。在两次 race 完成后,比较结果:
1

esrally compare --baseline=run-current --contender=run-contander
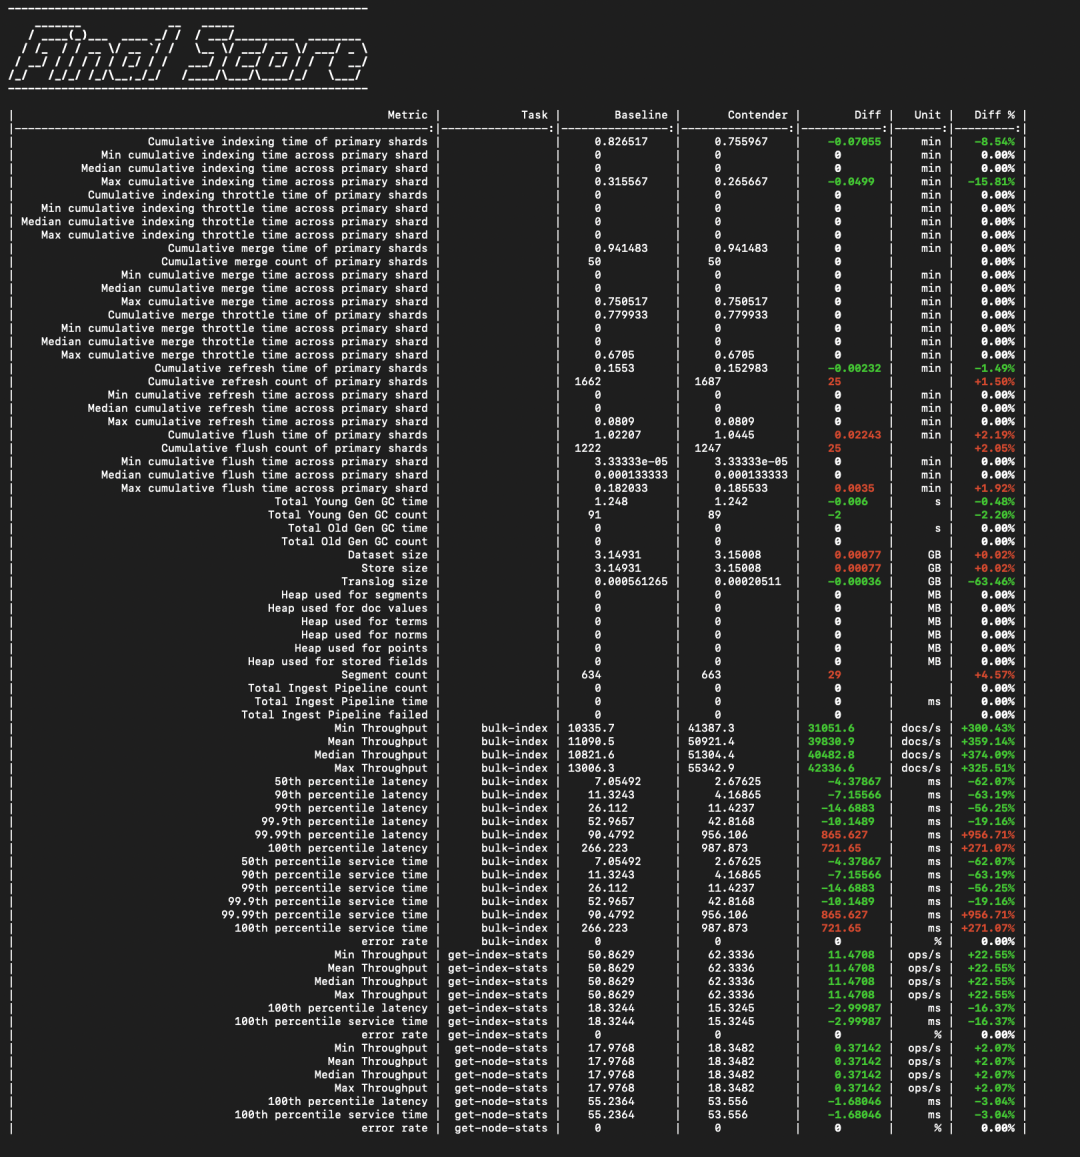
Terminal-style table titled “Final Score,” comparing performance metrics between baseline and contender configurations. Columns include Metric, Task, Baseline, Contender, Diff, Unit, and Diff %. Rows list indexing, merging, refreshing, flushing, garbage collection, dataset size, and throughput data. Green text indicates improvements, and red text indicates regressions.
Terminal-style table titled “Final Score,” comparing performance metrics between baseline and contender configurations. Columns include Metric, Task, Baseline, Contender, Diff, Unit, and Diff %. Rows list indexing, merging, refreshing, flushing, garbage collection, dataset size, and throughput data. Green text indicates improvements, and red text indicates regressions.
此外,报告会生成为 CSV 文件,可以轻松处理以提取重要数据。
Metric | Current settings | Contender | Change |
|---|---|---|---|
Cumulative indexing time | 0.826517 | 0.755967 | +8.54% |
Mean throughput | 11,090 docs/s | 50,921 docs/s | +359 % |
Median throughput | 10,821 docs/s | 51,304 docs/s | +374 % |
Min throughput | 10,335 docs/s | 41,387 docs/s | +300 % |
Max throughput | 13,006 docs/s | 55,342 docs/s | +326% |
候选配置带来了大约 3-4 倍更快的索引吞吐量,这完全归功于在批量加载阶段调整了 refresh_interval 和副本数。
在实践中,一次比较通常是不够的。常见的后续实验包括将 double 字段转换为 float 或 scaled_float,将 text 字段更改为 keyword,调整分片计数以及调整刷新间隔。由于 ES Rally track 可以快速重新运行,因此迭代这些选项非常简单。
当 Elasticsearch 不是瓶颈时该怎么办
如果 AutoOps 显示集群健康,Profile API 显示查询速度快,并且 ES Rally 确认索引设置不是限制因素,那么瓶颈就在客户端。此时,Elasticsearch 端不再是需要关注的地方。常见的应用程序层原因包括:
- • 网络延迟:客户端与集群之间的网络延迟,尤其是在跨区域、VPN 或代理的情况下。
- • 客户端反序列化开销:处理大型响应负载时产生的客户端反序列化开销。可以使用
_source exclude或fields参数,只返回客户端实际需要的数据。 - • 客户端排队:请求到达集群之前的客户端排队。Elasticsearch 客户端使用 HTTP 连接池。在并发负载下,请求会排队等待空闲连接。Profile API 无法看到这种等待,因为请求尚未离开客户端。
- • 单次搜索调用:本应使用
_msearch将独立的查询批量处理成一次网络往返,却使用了单次搜索调用。 - • 单文档索引:本应使用
_bulkAPI 将每个请求的开销分摊到多个文档上,却使用了单文档索引。
AutoOps、Profile API 和 ES Rally 的诊断价值恰恰在于它们能让您在转向应用程序代码之前,明确排除集群、查询和索引设置的问题。当这三个工具都显示没有问题时,调查就会从 Elasticsearch 转移到客户端。
为了在应用程序侧进行这些调查,Elastic APM 是一个很自然的下一步工具:它能跟踪通过客户端的请求路径,并精确地揭示 Profile API 无法看到的集群前等待时间。
结论
回到最初的问题,即物流配送平台上的搜索缓慢问题,我们从基础设施层面一直追溯到查询和设置层面:
- • AutoOps 揭示了分片分布不均,导致所有查询负载都集中在单个节点上,从而导致终端用户面临高达30秒的延迟峰值。
- • Profile API 显示,深度分页是慢查询的根源。从
from/size切换到search_after消除了98.9%的延迟。 - • ES Rally 证实,在批量数据摄入期间优化索引设置,特别是
refresh_interval和副本数,可以将吞吐量提高3-4倍。
每个工具都回答了不同的问题。AutoOps 提供了“结构上是否有问题?”的视图。Profile API 回答了“为什么这个特定查询很慢?”。而 ES Rally 验证了“这些更改是否真的改善了性能,以及改善了多少?”。按此顺序结合使用,它们涵盖了应用程序 Elasticsearch 侧的完整诊断范围。当这三个工具都显示没有问题时,下一步就是检查客户端,如前一节所述。
本文参与 腾讯云自媒体同步曝光计划,分享自微信公众号。
原始发表:2026-07-18,如有侵权请联系 cloudcommunity@tencent.com 删除
评论
登录后参与评论
推荐阅读
目录
腾讯云开发者

Copyright © 2013 - 2026 Tencent Cloud. All Rights Reserved. 腾讯云 版权所有
深圳市腾讯计算机系统有限公司 ICP备案/许可证号:粤B2-20090059  粤公网安备44030502008569号
腾讯云计算(北京)有限责任公司 京ICP证150476号 | 京ICP备11018762号