Python数据科学常见的30个库



Python作为数据科学领域最受欢迎的编程语言,其强大的生态系统主要由各种专用库构建而成。这些库覆盖了数据处理、可视化、机器学习、深度学习等各个方面,为数据科学及数据分析提供了全面而高效的工具集。本文将系统介绍30个重要的Python数据科学库,帮助快速掌握其核心功能。
1. Pandas:数据分析的“瑞士军刀”
说明:最常用的数据处理库,提供DataFrame和Series数据结构,支持数据清洗、转换、合并等操作。
import pandas as pd

data = {'产品': ['A', 'B', 'C', 'D'],
        '销售额': [1200, 1500, 1300, 1800],
        '成本': [800, 900, 1000, 1200]}
df = pd.DataFrame(data)
df['利润'] = df['销售额'] - df['成本']
high_profit = df[df['利润'] > 400]
print(high_profit)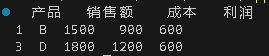
2. NumPy:科学计算基础库
说明:提供N维数组对象和数学函数库,支持大规模矩阵和数组运算。
import numpy as np

arr1 = np.array([[1, 2, 3], [4, 5, 6]])
arr2 = np.ones((2, 3))
result = arr1 * arr2 + 3
print("平均值:", np.mean(arr1))
print("标准差:", np.std(arr1))
print("形状:", arr1.shape)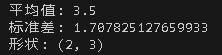
3. Dask:并行计算库
说明:适合处理大规模数据集的并行计算库,扩展Pandas和NumPy功能。
import dask.dataframe as dd

df = dd.demo.make_timeseries(npartitions=10, freq="15s", start_date="2020-01-01")
result = df.groupby('name').x.mean().compute()
print(result)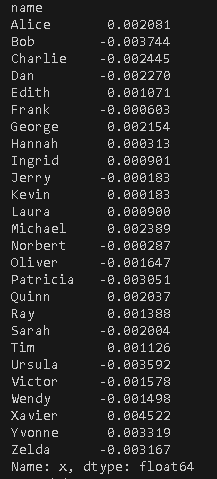
4. Polars:高性能DataFrame库
说明:使用Rust编写的高性能DataFrame库,具有强大的表达式系统。
import polars as pl
import numpy as np

df = pl.DataFrame({
    'id': range(1000),
    'value': np.random.rand(1000)
})
result = df.filter(pl.col('value') > 0.5).group_by('id').agg(pl.col('value').mean())
print(result)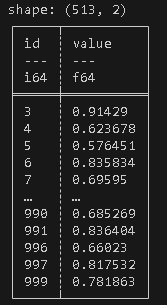
5. Matplotlib:基础绘图库
说明:最基础的2D绘图库,提供全面的图表绘制功能。
import matplotlib.pyplot as plt
import numpy as np

x = np.linspace(0, 10, 100)
y1 = np.sin(x)
y2 = np.cos(x)
plt.figure(figsize=(10, 6))
plt.plot(x, y1, label='sin(x)', linewidth=2)
plt.plot(x, y2, label='cos(x)', linestyle='--')
plt.xlabel('X轴')
plt.ylabel('Y轴')
plt.title('三角函数图')
plt.legend()
plt.grid(True)
plt.show()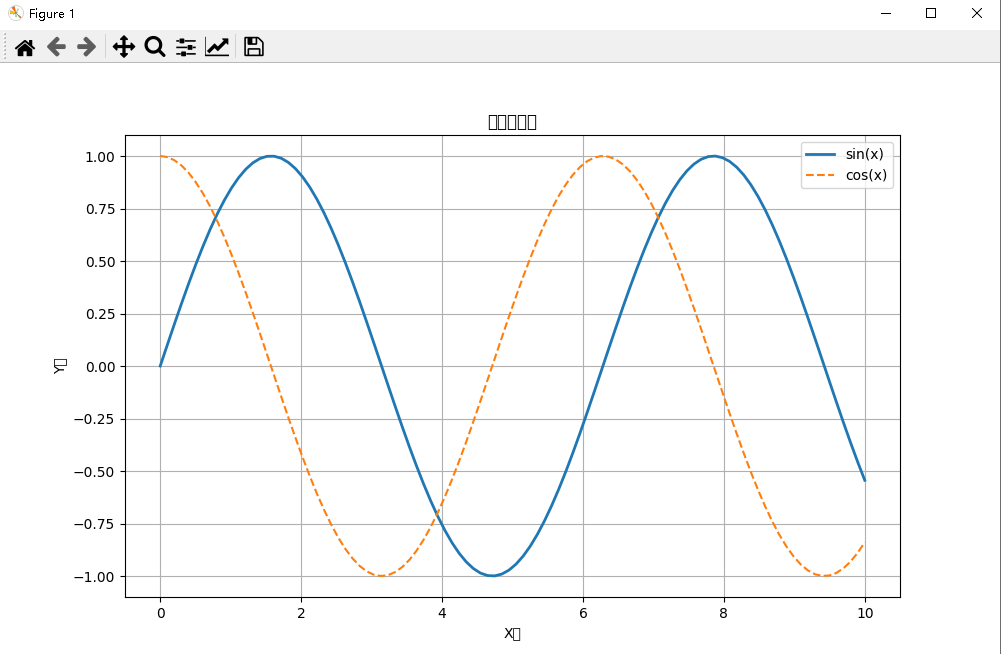
6. Seaborn:统计可视化库
说明:基于Matplotlib,提供更美观的统计图形和高级API。
import seaborn as sns

tips = sns.load_dataset('tips')
g = sns.FacetGrid(tips, col='time', row='smoker')
g.map(sns.scatterplot, 'total_bill', 'tip', alpha=0.7)
g.add_legend()
g.fig.suptitle('小费与总账单关系图', y=1.03)
plt.tight_layout()
plt.show()
7. Plotly:交互式可视化库
说明:提供丰富的交互式图表,支持缩放、平移和悬停操作。
import plotly.express as px

df = px.data.gapminder().query("year == 2007")
fig = px.scatter(df, x='gdpPercap', y='lifeExp', size='pop',
                 color='continent', hover_name='country',
                 log_x=True, size_max=60,
                 title='2007年国家GDP与寿命关系')
fig.show()
8. Bokeh:Web交互式可视化
说明:专注于现代Web浏览器的可视化展示,支持大规模数据集。
from bokeh.plotting import figure, show
from bokeh.io import output_notebook
from bokeh.models import HoverTool

output_notebook()
x = [1, 2, 3, 4, 5]
y = [6, 7, 2, 4, 8]
p = figure(title='简单折线图', x_axis_label='X', y_axis_label='Y')
p.line(x, y, line_width=2, legend_label='趋势线')
p.scatter(x, y, size=10, fill_color='white')
hover = HoverTool(tooltips=[('值', '@y')])
p.add_tools(hover)
show(p)
9. Scikit-learn:经典机器学习库
说明:著名的机器学习库,提供统一API用于数据预处理、模型训练和评估。
from sklearn.datasets import load_iris
from sklearn.ensemble import RandomForestClassifier
from sklearn.model_selection import train_test_split
from sklearn.metrics import accuracy_score, classification_report

iris = load_iris()
X, y = iris.data, iris.target
X_train, X_test, y_train, y_test = train_test_split(X, y, test_size=0.3)
model = RandomForestClassifier(n_estimators=100, random_state=42)
model.fit(X_train, y_train)
y_pred = model.predict(X_test)
print(f'准确率: {accuracy_score(y_test, y_pred):.2f}')
print(classification_report(y_test, y_pred, target_names=iris.target_names))
10. XGBoost:梯度提升库
说明:优化的分布式梯度提升库,在数据科学竞赛中广泛应用。
import xgboost as xgb
from sklearn.datasets import make_classification

X, y = make_classification(n_samples=1000, n_features=10, random_state=42)
dtrain = xgb.DMatrix(X, label=y)
params = {
    'max_depth': 6,
    'eta': 0.3,
    'objective': 'binary:logistic',
    'eval_metric': 'logloss'
}
model = xgb.train(params, dtrain, num_boost_round=100)
y_pred = model.predict(dtrain)
y_binary = [1 if p > 0.5 else 0 for p in y_pred]
print('预测结果:', y_binary[:10])
11. LightGBM:轻量级梯度提升机
说明:微软开发的基于决策树的梯度提升框架,训练速度快且内存消耗低。
import lightgbm as lgb
import numpy as np

X = np.random.rand(1000, 10)
y = np.random.randint(0, 2, 1000)
train_data = lgb.Dataset(X, label=y)
params = {
    'objective': 'binary',
    'metric': 'binary_logloss',
    'num_leaves': 31,
    'learning_rate': 0.05
}
model = lgb.train(params, train_data, num_boost_round=100)
importance = model.feature_importance()
print('特征重要性:', importance)
12. Statsmodels:统计分析库
说明:提供丰富的统计模型和检验方法,专注于传统统计学。
import statsmodels.api as sm
import numpy as np

np.random.seed(42)
X = np.random.randn(100, 2)
y = 2.5 + 1.2 * X[:,0] + 0.8 * X[:,1] + np.random.randn(100) * 0.5
X = sm.add_constant(X)
model = sm.OLS(y, X).fit()
print(model.summary())
13. TensorFlow:端到端机器学习平台
说明:Google开发的开源机器学习框架,支持从研究到生产的全流程。
import tensorflow as tf
from tensorflow.keras import layers, models
import numpy as np

model = models.Sequential([
    layers.Dense(64, activation='relu', input_shape=(10,)),
    layers.Dropout(0.2),
    layers.Dense(32, activation='relu'),
    layers.Dense(1, activation='sigmoid')
])
model.compile(optimizer='adam', loss='binary_crossentropy', metrics=['accuracy'])
model.summary()
X_train = np.random.random((1000, 10))
y_train = np.random.randint(0, 2, (1000, 1))
history = model.fit(X_train, y_train, epochs=10, batch_size=32, validation_split=0.2)
14. PyTorch:灵活深度学习框架
说明:Facebook开发的深度学习框架,以其动态计算图受到研究人员青睐。
import torch
import torch.nn as nn
import torch.optim as optim

class SimpleNN(nn.Module):
    def __init__(self):
        super(SimpleNN, self).__init__()
        self.fc1 = nn.Linear(10, 50)
        self.fc2 = nn.Linear(50, 20)
        self.fc3 = nn.Linear(20, 1)
        self.relu = nn.ReLU()
        self.sigmoid = nn.Sigmoid()

    def forward(self, x):
        x = self.relu(self.fc1(x))
        x = self.relu(self.fc2(x))
        x = self.sigmoid(self.fc3(x))
        return x

model = SimpleNN()
criterion = nn.BCELoss()
optimizer = optim.Adam(model.parameters(), lr=0.001)
X = torch.randn(100, 10)
y = torch.randint(0, 2, (100, 1)).float()

for epoch in range(10):
    optimizer.zero_grad()
    outputs = model(X)
    loss = criterion(outputs, y)
    loss.backward()
    optimizer.step()
    if epoch % 5 == 0:
        print(f'Epoch {epoch}, Loss: {loss.item():.4f}')
15. Keras:高级神经网络API
说明:TensorFlow的高级API,提供简洁接口构建和训练深度学习模型。
from tensorflow import keras
from tensorflow.keras import layers

model = keras.Sequential([
    layers.Conv2D(32, (3, 3), activation='relu', input_shape=(28, 28, 1)),
    layers.MaxPooling2D((2, 2)),
    layers.Conv2D(64, (3, 3), activation='relu'),
    layers.MaxPooling2D((2, 2)),
    layers.Flatten(),
    layers.Dense(64, activation='relu'),
    layers.Dense(10, activation='softmax')
])
model.compile(optimizer='adam',
              loss='sparse_categorical_crossentropy',
              metrics=['accuracy'])
keras.utils.plot_model(model, show_shapes=True)
16. NLTK:自然语言工具包
说明:构建Python程序处理人类语言数据的平台,适合教学和研究。
import nltk
from nltk.tokenize import word_tokenize, sent_tokenize
from nltk.corpus import stopwords
from nltk.stem import PorterStemmer

nltk.download('punkt')
nltk.download('stopwords')

text = "Natural language processing is a fascinating field. It helps computers understand human language."
sentences = sent_tokenize(text)
tokens = word_tokenize(text)
stop_words = set(stopwords.words('english'))
filtered_words = [word for word in tokens if word.lower() not in stop_words]
stemmer = PorterStemmer()
stemmed = [stemmer.stem(word) for word in filtered_words]
print("句子分割:", sentences)
print("词语分割:", tokens)
print("去除停用词:", filtered_words)
print("词干提取:", stemmed)
17. spaCy:工业级NLP库
说明:针对工业应用的NLP库,注重高性能和易用性。
import spacy

nlp = spacy.load('en_core_web_sm')
text = "Apple is looking at buying U.K. startup for $1 billion. The meeting happened in New York."
doc = nlp(text)

print("命名实体识别:")
for ent in doc.ents:
    print(f"{ent.text} - {ent.label_} - {spacy.explain(ent.label_)}")

print("\n词性标注:")
for token in doc:
    print(f"{token.text} - {token.pos_} - {spacy.explain(token.pos_)}")
18. Gensim:主题建模库
说明:专注于无监督主题建模和文档相似度计算,适合处理大型文本集合。
from gensim import corpora
from gensim.models import LdaModel
from gensim.parsing.preprocessing import preprocess_string

documents = [
    "Machine learning is a subset of artificial intelligence",
    "Deep learning uses neural networks with multiple layers",
    "Natural language processing helps computers understand text",
    "Computer vision enables machines to interpret images"
]
processed_docs = [preprocess_string(doc) for doc in documents]
dictionary = corpora.Dictionary(processed_docs)
corpus = [dictionary.doc2bow(doc) for doc in processed_docs]
lda_model = LdaModel(corpus=corpus, id2word=dictionary,
                     num_topics=2, random_state=42, passes=10)
for idx, topic in lda_model.print_topics():
    print(f"主题 {idx}: {topic}")
19. OpenCV:计算机视觉库
说明:开源的计算机视觉和机器学习库,包含数千种优化算法。
import cv2
import numpy as np
import matplotlib.pyplot as plt

image = np.zeros((300, 300), dtype=np.uint8)
for i in range(300):
    image[:, i] = i * 255 / 299

_, thresh = cv2.threshold(image, 127, 255, cv2.THRESH_BINARY)
edges = cv2.Canny(image, 100, 200)

fig, axes = plt.subplots(1, 3, figsize=(15, 5))
axes[0].imshow(image, cmap='gray')
axes[0].set_title('原图')
axes[1].imshow(thresh, cmap='gray')
axes[1].set_title('阈值处理')
axes[2].imshow(edges, cmap='gray')
axes[2].set_title('边缘检测')

for ax in axes:
    ax.axis('off')
plt.tight_layout()
plt.show()
20. Pillow:图像处理库
说明:友好的图像处理库,提供广泛的文件格式支持和图像处理功能。
from PIL import Image, ImageFilter, ImageDraw, ImageFont

img = Image.new('RGB', (400, 300), color='lightblue')
draw = ImageDraw.Draw(img)
draw.rectangle([50, 50, 200, 150], fill='red', outline='darkred')
draw.ellipse([250, 100, 350, 200], fill='green', outline='darkgreen')

try:
    font = ImageFont.truetype("arial.ttf", 24)
except:
    font = ImageFont.load_default()

draw.text((150, 250), "Pillow示例", fill='black', font=font)
filtered_img = img.filter(ImageFilter.BLUR)
img.show()
filtered_img.show()
21. Requests:HTTP库
说明:最简单易用的HTTP库,用于发送各种HTTP请求。
import requests
import json

response = requests.get(' https://jsonplaceholder.typicode.com/posts')
if response.status_code == 200:
    posts = response.json()
    for i, post in enumerate(posts[:3]):
        print(f"{i+1}. 标题: {post['title']}")
        print(f"   内容: {post['body'][:50]}...")
        print()

new_post = {
    'title': '测试标题',
    'body': '测试内容',
    'userId': 1
}
response = requests.post(' https://jsonplaceholder.typicode.com/posts', json=new_post)
print(f"POST响应状态: {response.status_code}")
22. Scrapy:网络爬虫框架
说明:快速、高层次的Web爬取框架,用于抓取网站数据并提取结构化数据。
import scrapy
from scrapy.crawler import CrawlerProcess

class QuoteSpider(scrapy.Spider):
    name = 'quotes'
    start_urls = [' http://quotes.toscrape.com/page/1/' ]

    def parse(self, response):
        for quote in response.css('div.quote'):
            yield {
                'text': quote.css('span.text::text').get(),
                'author': quote.css('small.author::text').get(),
                'tags': quote.css('div.tags a.tag::text').getall()
            }
        next_page = response.css('li.next a::attr(href)').get()
        if next_page is not None:
            yield response.follow(next_page, self.parse)

process = CrawlerProcess(settings={
    'FEED_FORMAT': 'json',
    'FEED_URI': 'quotes.json'
})
process.crawl(QuoteSpider)
process.start()
23. SQLAlchemy:数据库ORM
说明:SQL工具包和对象关系映射库,提供企业级持久化模式。
from sqlalchemy import create_engine, Column, Integer, String
from sqlalchemy.ext.declarative import declarative_base
from sqlalchemy.orm import sessionmaker

Base = declarative_base()

class User(Base):
    __tablename__ = 'users'
    id = Column(Integer, primary_key=True)
    name = Column(String(50))
    email = Column(String(100))

    def __repr__(self):
        return f"<User(name='{self.name}', email='{self.email}')>"

engine = create_engine('sqlite:///example.db')
Base.metadata.create_all(engine)
Session = sessionmaker(bind=engine)
session = Session()

new_user = User(name='张三', email='zhangsan@example.com')
session.add(new_user)
session.commit()

users = session.query(User).all()
for user in users:
    print(user)
24. Jupyter:交互式计算环境
说明:开源的Web应用程序,允许创建和共享包含实时代码、公式和可视化的文档。
# 在Jupyter Notebook中运行
%matplotlib inline
%timeit [x**2 for x in range(1000)]

from IPython.core.interactiveshell import InteractiveShell
InteractiveShell.ast_node_interactivity = "all"

from ipyparallel import Client
rc = Client()
view = rc[:]
result = view.map(lambda x: x**2, range(10))
print("并行计算结果:", result.get())
25. SciPy:科学计算库
说明:基于NumPy的科学计算库,提供数学、科学和工程计算功能。
from scipy import optimize
import numpy as np

def f(x):
    return x**2 + 10*np.sin(x)

result = optimize.minimize(f, x0=0)
print("最小值:", result.x)
print("函数值:", result.fun)
26. BeautifulSoup:网页解析库
说明:用于解析HTML和XML文档的库,适合网页数据提取。
from bs4 import BeautifulSoup

html_doc = """
<html>
<head><title>测试页面</title></head>
<body>
<p class="title"><b>测试文档</b></p>
<p class="content">这是一个测试段落。</p>
</body>
</html>
"""

soup = BeautifulSoup(html_doc, 'html.parser')
print("标题:", soup.title.string)
print("段落:", soup.find('p', class_='content').text)
27. PyMySQL:MySQL客户端库
说明:纯Python实现的MySQL客户端库。
import pymysql

# 连接数据库
connection = pymysql.connect(
    host='localhost',
    user='username',
    password='password',
    database='test_db'
)

try:
    with connection.cursor() as cursor:
        # 创建表
        cursor.execute("CREATE TABLE IF NOT EXISTS users (id INT, name VARCHAR(50))")
        # 插入数据
        cursor.execute("INSERT INTO users VALUES (1, '张三')")
    connection.commit()
    print("数据插入成功")
finally:
    connection.close()
28. Os:操作系统交互库
说明:提供与操作系统交互功能的库。
import os

# 获取当前工作目录
print("当前目录:", os.getcwd())

# 列出目录内容
print("目录内容:", os.listdir('.'))

# 创建目录
os.makedirs('test_dir', exist_ok=True)
print("目录创建成功")

# 环境变量
print("PATH环境变量:", os.getenv('PATH'))
29. Sys:系统相关功能库
说明:用于访问Python解释器相关变量和函数的库。
import sys

# Python版本信息
print("Python版本:", sys.version)

# 命令行参数
print("命令行参数:", sys.argv)

# 模块搜索路径
print("模块路径:", sys.path[:3])

# 退出程序
# sys.exit(0)
30. Re:正则表达式库
说明:正则表达式库,用于字符串匹配和处理。
import re

text = "我的电话是123-4567-8901,邮箱是test@example.com"

# 匹配电话号码
phone_pattern = r'\d{3}-\d{4}-\d{4}'
phones = re.findall(phone_pattern, text)
print("电话号码:", phones)

# 匹配邮箱
email_pattern = r'\b[A-Za-z0-9._%+-]+@[A-Za-z0-9.-]+\.[A-Z|a-z]{2,}\b'
emails = re.findall(email_pattern, text)
print("邮箱地址:", emails)

# 替换文本
new_text = re.sub(phone_pattern, '***-****-****', text)
print("替换后文本:", new_text)Python数据科学库涵盖了数据处理、可视化、机器学习、深度学习、自然语言处理、图像处理等多个领域。掌握这些库的使用方法,将大大提高数据科学工作的效率和效果。根据具体项目需求选择合适的工具。
1、根据任务规模选择合适的库(如Pandas适合中小数据,Dask适合大数据)。
2、熟练掌握核心库(NumPy、Pandas、Matplotlib、Scikit-learn)后再学习其他库。
3、关注库的文档和社区支持。
4、实践是学习的最佳途径,多动手完成实际项目。
“无他,惟手熟尔”!有需要的用起来!
如果你觉得这篇文章有用,欢迎点赞、转发、收藏、留言、推荐❤!
本文参与 腾讯云自媒体同步曝光计划,分享自微信公众号。
原始发表:2025-12-11,如有侵权请联系 cloudcommunity@tencent.com 删除
目录
腾讯云开发者

Copyright © 2013 - 2026 Tencent Cloud. All Rights Reserved. 腾讯云 版权所有
深圳市腾讯计算机系统有限公司 ICP备案/许可证号:粤B2-20090059  粤公网安备44030502008569号
腾讯云计算(北京)有限责任公司 京ICP证150476号 | 京ICP备11018762号