PostgreSQL 数据扫描方法原理详解

PostgreSQL 数据扫描方法原理详解

用户4035096
发布于 2026-07-09 20:41:28
发布于 2026-07-09 20:41:28
PostgreSQL 数据扫描方法原理详解
你想知道PostgreSQL在存储中是如何组织数据的吗?
你想知道PostgreSQL是如何从已经组织好的数据中扫描数据的吗?
你想知道PostgreSQL有多少扫描方法吗?
你想知道PostgreSQL如何选择扫描方法的吗?
你想知道不同的扫描方法是如何运行的吗?
你想知道什么情况该选择什么样的扫描方法吗?
看这篇文章: https://www.crunchydata.com/blog/postgres-scan-types-in-explain-plans
Postgres Scan Types in EXPLAIN Plans
开启性能提升的关键,往往不仅在于您在查询中提出了什么,而在于 Postgres 如何找到答案。Postgres 的 EXPLAIN(执行计划)系统对于理解数据是如何被查询的非常有用。阅读 EXPLAIN plans(执行计划)的秘诀之一是理解用于检索数据的扫描类型(scan type)。扫描类型可能是闪电般的快速响应与缓慢查询之间的区别。
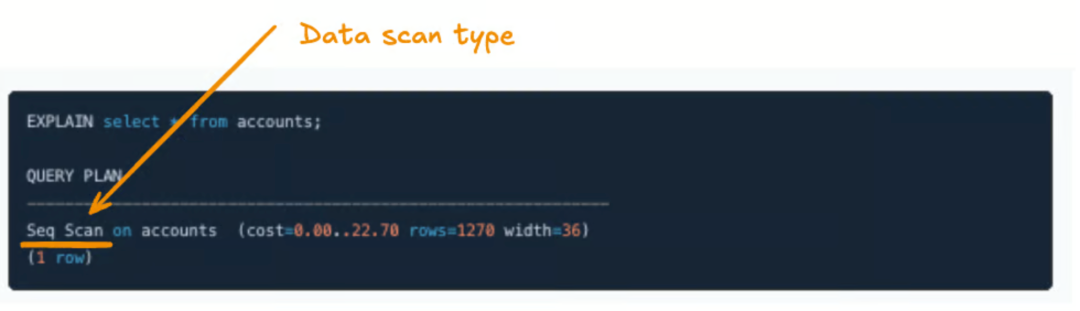
今天,我将分解最常见的扫描类型,它们如何工作,以及您何时会在查询中看到它们。
Sequential scan (顺序扫描, seq scan)
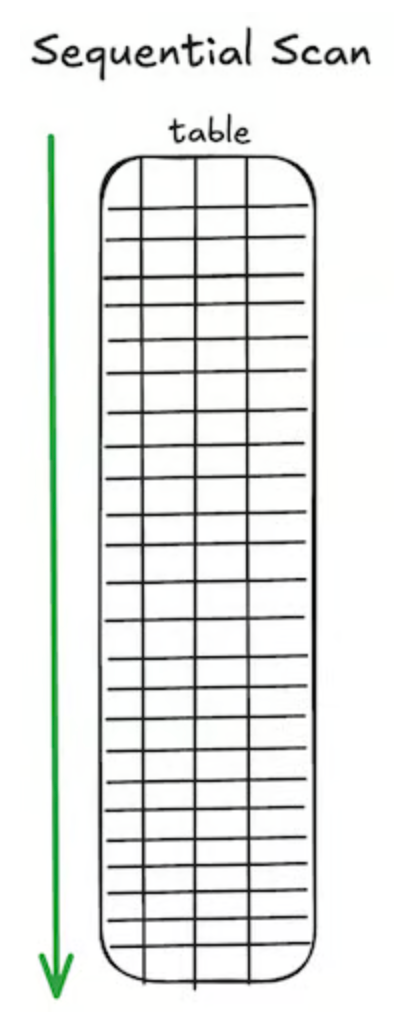
这种数据扫描会读取整个表,逐行检查是否匹配查询条件。如果您有 WHERE 或 FILTER 子句,Postgres 只会扫描每一行寻找匹配项。
顺序扫描(Sequence scans)是扫描执行方式的基础,对于许多搜索来说,这是 Postgres 将使用的默认方式。对于非常大的数据集或经常被查询的数据集,顺序扫描并不理想,索引扫描(index scan)可能会更快。因此,在阅读 EXPLAIN plan(执行计划)时,区分顺序扫描(seq scan)和索引扫描(index scan)是最重要的部分之一。
EXPLAIN select * from accounts;
QUERY PLAN
-------------------------------------------------------------
Seq Scan on accounts (cost=0.00..22.70 rows=1270 width=36)
(1 row)
Index Scan (索引扫描)
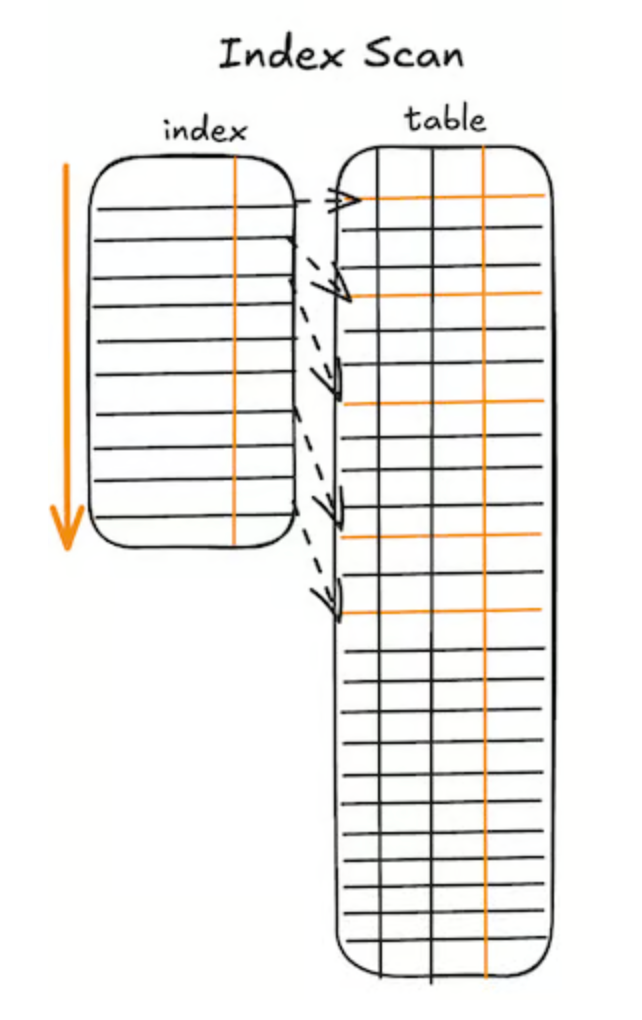
当您在 Postgres 中创建索引时,您正在创建磁盘上存储的单列或多列引用。Postgres 能够使用此索引作为存储在表中的数据地图。基本的索引扫描使用 B-tree(B-树)来快速找到数据的确切位置,它使用一个两步过程:首先 Postgres 在索引中找到条目,使用该引用,然后它从表中获取(fetches)其余的行数据。
EXPLAIN select * from accounts where id = '5';
QUERY PLAN
-------------------------------------------------------------------------------
Index Scan using accounts_pkey on accounts (cost=0.15..2.37 rows=1 width=36)
Index Cond: (id = 5)
(2 rows)
请注意,primary keys(主键)会自动使用 b-tree index(B-树索引)进行索引,因此涉及主键的查询可能会使用索引扫描。
在 Postgres 中,当查询只需要从一个大表中检索非常小的一部分行时,索引扫描通常比顺序扫描快。使用索引比扫描整个表更快。
然而,索引扫描并非总是更快。在许多情况下,Postgres 的 query planner(查询规划器)会正确地选择顺序扫描。这通常发生在被扫描的表很小,或者返回的行百分比超过了使用索引的效益时。如果一个查询返回大约 10% 的行,顺序扫描可能更快。
Bitmap Index Scan (位图索引扫描)
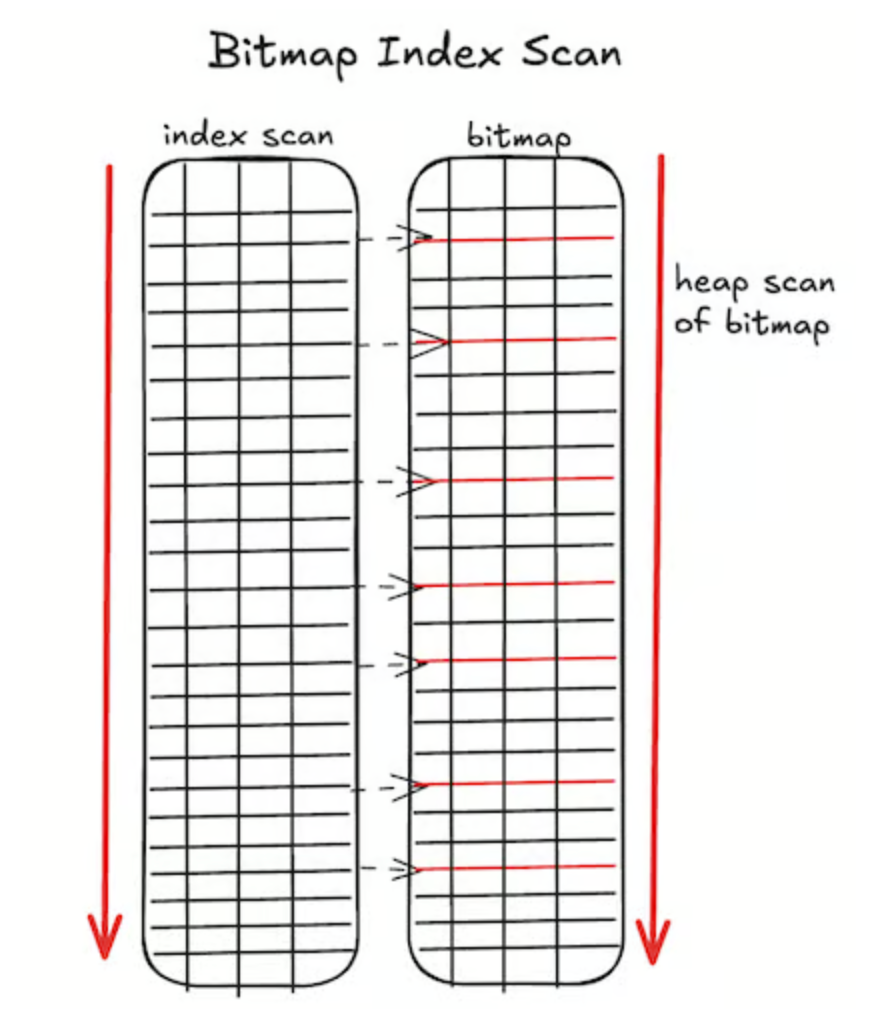
如果索引扫描或顺序扫描都不是完美的选项,Postgres 可以使用位图索引扫描作为一种混合(hybrid)方法。当查询匹配的行数过多,不适合常规索引扫描,但又不足以让顺序扫描成为最佳选择时,通常会选择它。
这在 EXPLAIN plan(执行计划)中显示为一个两阶段方法。
Bitmap Index Scan(位图索引扫描) : 首先,Postgres 扫描一个或多个索引,以创建一个内存中的“位图”(bitmap),这是一个包含您可能需要的行的所有表页(table pages)的简单地图。Bitmap Heap Scan(位图堆扫描) : 位图用于访问主表。这里的关键是它按顺序读取磁盘上所需的页,这比标准索引扫描的随机跳转要快得多。
当查询具有多个过滤条件,且每个条件都有单独的索引时,位图索引扫描很常见。位图扫描允许数据库同时使用不同列上的独立索引。当 WHERE 条件由 AND 或 OR 运算符连接时,您会看到这种扫描出现。
EXPLAIN SELECT customer_id, registration_date
FROM customer_records
WHERE gender = 'F'
AND state_code = 'KS';
QUERY PLAN
----------------------------------------------------------------------------------------------------------------------------------------
Bitmap Heap Scan on customer_records (cost=835.78..8669.29 rows=49226 width=12) (actual time=5.717..38.642 rows=50184.00 loops=1)
Recheck Cond: (state_code = 'NY'::bpchar)
Filter: (gender = 'F'::bpchar)
Rows Removed by Filter: 49682
Heap Blocks: exact=6370
Buffers: shared hit=6370 read=87
-> Bitmap Index Scan on idx_customer_state (cost=0.00..823.48 rows=97567 width=0) (actual time=4.377..4.378 rows=99866.00 loops=1)
Index Cond: (state_code = 'NY'::bpchar)
Index Searches: 1
Buffers: shared read=87
Planning:
Buffers: shared hit=27 read=2
Planning Time: 0.774 ms
Execution Time: 40.572 ms
(14 rows)
Parallel Sequential Scan (并行顺序扫描, parallel seq scan)
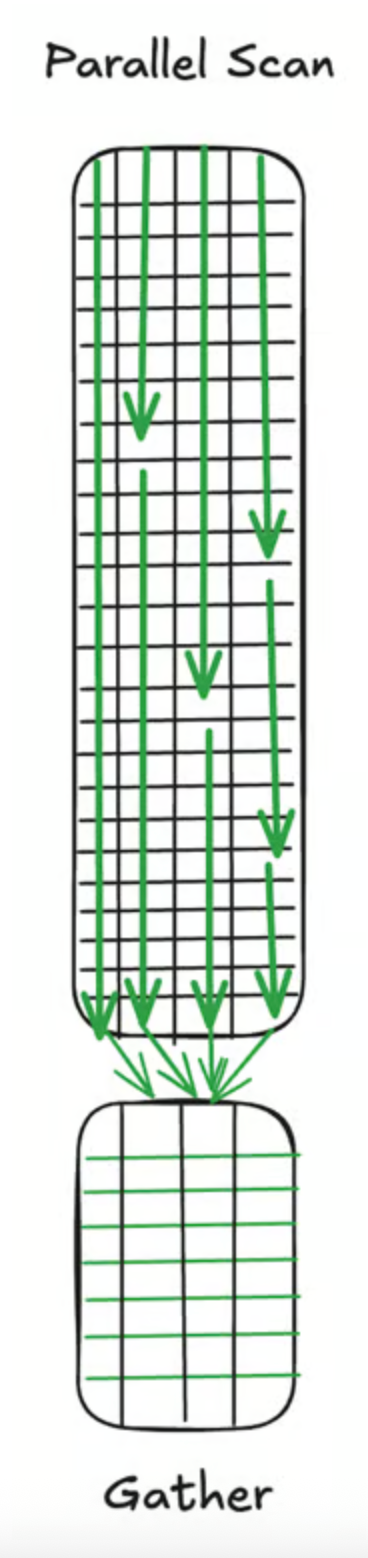
当 Postgres 使用多个后台工作进程(background workers)同时对一个大型表执行多个顺序扫描时,您会看到并行顺序扫描。表被分成块(chunks),每个工作进程获得一个块进行扫描,结果在末尾的收集进程(gather process)中组合起来。根据您的查询,在并行查询之后和最终收集之前,您可能还会有一个聚合(aggregate)或排序(sort)操作。这是 Postgres 并行查询功能的一部分。
EXPLAIN (ANALYZE, VERBOSE, BUFFERS)
SELECTid, data_value
FROM parallel_test
WHERE data_value < 100000
ORDERBY data_value DESC
LIMIT1000;
QUERY PLAN
------------------------------------------------------------------------------------------------------------------------------------------------------------
Limit (cost=161310.11..161431.04 rows=1000 width=16) (actual time=130.300..140.555 rows=1000.00 loops=1)
Output: id, data_value
Buffers: shared hit=142685
-> Gather Merge (cost=161310.11..220311.14rows=487915 width=16) (actual time=130.299..140.468rows=1000.00 loops=1)
Output: id, data_value
Workers Planned: 5
Workers Launched: 5
Buffers: shared hit=142685
-> Sort (cost=160310.04..160553.99rows=97583 width=16) (actual time=112.942..112.973rows=861.17 loops=6)
Output: id, data_value
SortKey: parallel_test.data_value DESC
Sort Method: top-N heapsort Memory: 163kB
Buffers: shared hit=142685
Worker 0: actual time=112.535..112.571rows=1000.00 loops=1
Sort Method: top-N heapsort Memory: 164kB
Buffers: shared hit=21729
Worker 1: actual time=112.271..112.308rows=1000.00 loops=1
Sort Method: top-N heapsort Memory: 164kB
Buffers: shared hit=21573
Worker 2: actual time=112.465..112.500rows=1000.00 loops=1
Sort Method: top-N heapsort Memory: 164kB
Buffers: shared hit=20549
Worker 3: actual time=99.099..99.133rows=1000.00 loops=1
Sort Method: top-N heapsort Memory: 163kB
Buffers: shared hit=17033
Worker 4: actual time=112.333..112.368rows=1000.00 loops=1
Sort Method: top-N heapsort Memory: 163kB
Buffers: shared hit=19964
-> Parallel Seq Scanon public.parallel_test (cost=0.00..154959.67rows=97583 width=16) (actual time=19.238..99.868rows=83250.83 loops=6)
Output: id, data_value
Filter: (parallel_test.data_value < '100000'::numeric)
Rows Removed by Filter: 750082
Buffers: shared hit=142500
Worker 0: actual time=18.837..99.169rows=83026.00 loops=1
Buffers: shared hit=21692
Worker 1: actual time=18.594..99.301rows=84378.00 loops=1
Buffers: shared hit=21536
Worker 2: actual time=18.706..99.551rows=79196.00 loops=1
Buffers: shared hit=20512
Worker 3: actual time=5.308..86.023rows=81187.00 loops=1
Buffers: shared hit=16996
Worker 4: actual time=18.694..99.497rows=83574.00 loops=1
Buffers: shared hit=19927
Planning:
Buffers: shared hit=15
Planning Time: 0.315 ms
Execution Time: 140.635 ms
(47rows)
Parallel index scan (并行索引扫描)
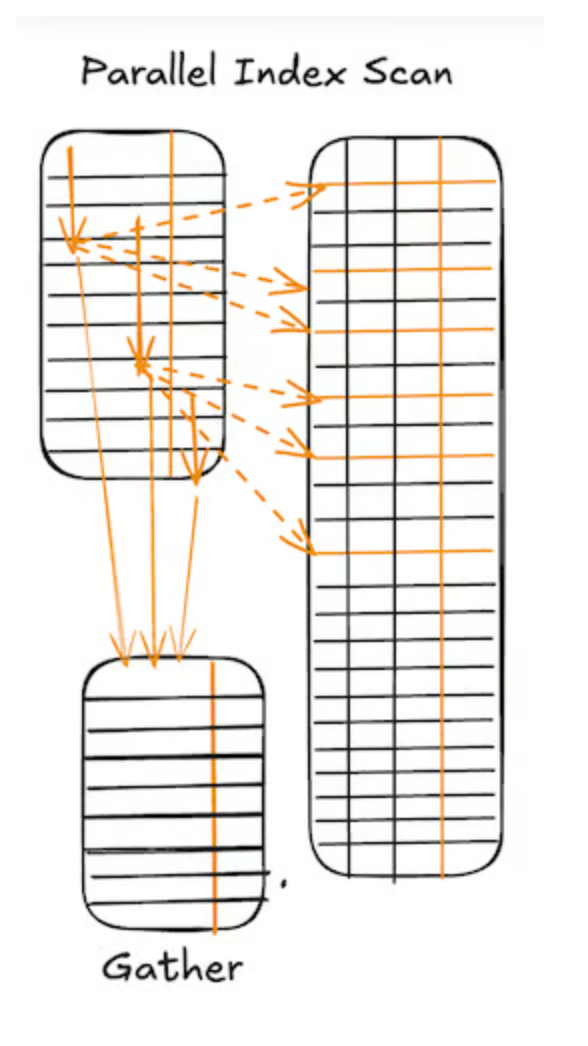
并行索引扫描使用相同的并行工作进程同时扫描索引。它采用索引扫描的相同方法——只是多个工作进程同时执行。每个进程读取索引的不同部分并返回结果。像其他并行扫描一样,它以一个收集(gather)操作结束。
当涉及的索引和表非常大,并且拆分和最终收集的整个操作比交给单个工作进程更快时,您会看到并行索引扫描。
EXPLAIN (ANALYZE, VERBOSE, BUFFERS)
SELECT data_id, filler_text
FROM parallel_index_test
WHERE data_id BETWEEN1000000AND2000000;
QUERY PLAN
---------------------------------------------------------------------------------------------------------------------------------------------------------------------------
Gather (cost=0.43..34560.34 rows=995971 width=109) (actual time=1.014..145.796 rows=1000001.00 loops=1)
Output: data_id, filler_text
Workers Planned: 4
Workers Launched: 4
Buffers: shared hit=23385
-> Parallel Index Scan using idx_data_id on public.parallel_index_test (cost=0.43..33564.37 rows=248993 width=109) (actual time=0.941..38.211 rows=200000.20 loops=5)
Output: data_id, filler_text
Index Cond: ((parallel_index_test.data_id >= 1000000) AND (parallel_index_test.data_id <= 2000000))
Index Searches: 1
Buffers: shared hit=23385
Worker 0: actual time=2.104..45.540 rows=240638.00 loops=1
Buffers: shared hit=5640
Worker 1: actual time=2.174..45.169 rows=240096.00 loops=1
Buffers: shared hit=5638
Worker 2: actual time=0.067..45.380 rows=242658.00 loops=1
Buffers: shared hit=5693
Worker 3: actual time=0.306..45.122 rows=242292.00 loops=1
Buffers: shared hit=5686
Planning:
Buffers: shared hit=4
Planning Time: 0.526 ms
Execution Time: 180.660 ms
(22 rows)
Index-Only Scan (仅索引扫描)
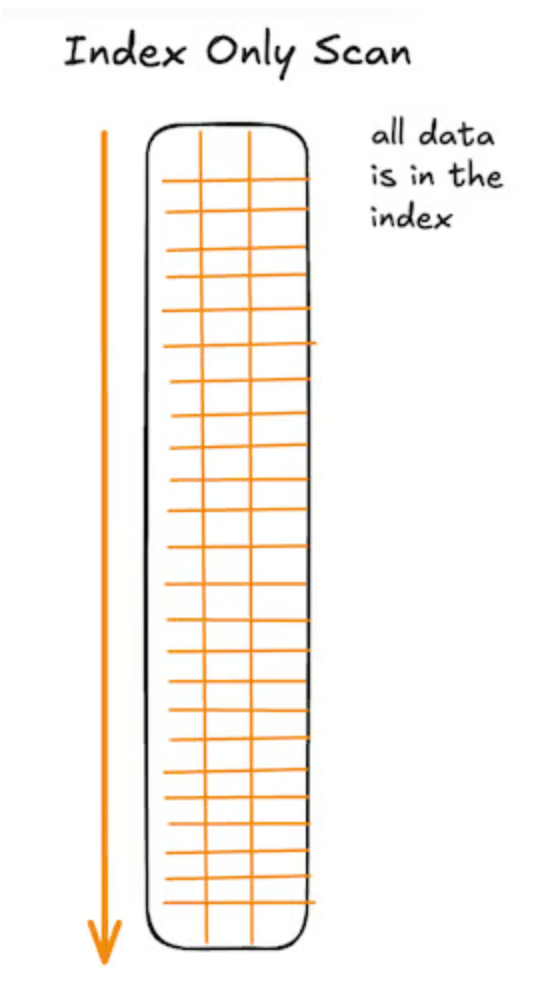
仅索引扫描(Index-Only Scan)是扫描中的“超级明星”,它仅使用索引本身存储的信息来回答整个查询。仅索引扫描也称为 “覆盖索引” (covering indexes),这意味着索引本身覆盖了所有数据。它甚至不需要访问主表(main table)或堆表(heap table)。仅索引扫描是一个巨大的性能提升,因为它速度非常快 —— 不需要从堆表(heap table)中检索任何信息。它们通常也使用更少的 I/O 资源,因为索引非常缓存友好(cache friendly),并且通常位于 shared buffers(共享缓冲区)中——这意味着不需要从底层磁盘读取数据。
在以下情况下,查询会从覆盖索引中受益:
- 查询执行频率非常高。
- 当前查询正在执行标准索引扫描,随后是许多缓慢的磁盘读取(
heap fetches,堆提取)并使用了 I/O。 - 查询只需要表中的一小部分列,例如您从一个有二十列的表中仅选择三列。
- 这些列的写入频率较低。任何被索引的列都必须写入磁盘和索引,所以如果您开始为所有列添加覆盖索引,您实际上是在创建写入放大(
write amplification)。 - 必须覆盖所有所需列的新索引不会太大。索引存储在磁盘上,所以您不希望引起存储问题。
EXPLAIN (ANALYZE, VERBOSE, BUFFERS)
SELECT code, status
FROM index_only_test
WHERE code > 'CODE_050000'
ORDERBY code
LIMIT100;
QUERY PLAN
----------------------------------------------------------------------------------------------------------------------------------------------------------------
Limit (cost=0.42..2.60 rows=100 width=13) (actual time=0.346..0.362 rows=100.00 loops=1)
Output: code, status
Buffers: shared hit=1 read=3
-> Index Only Scan using idx_code_status on public.index_only_test (cost=0.42..1068.02 rows=49000 width=13) (actual time=0.345..0.352 rows=100.00 loops=1)
Output: code, status
Index Cond: (index_only_test.code > 'CODE_050000'::text)
Heap Fetches: 0
Index Searches: 1
Buffers: shared hit=1 read=3
Planning:
Buffers: shared hit=19
Planning Time: 1.838 ms
Execution Time: 0.385 ms
(13 rows)
总结
我们已经涵盖了所有主要的扫描类型,现在阅读您的 EXPLAIN plans(执行计划)将更容易一些。
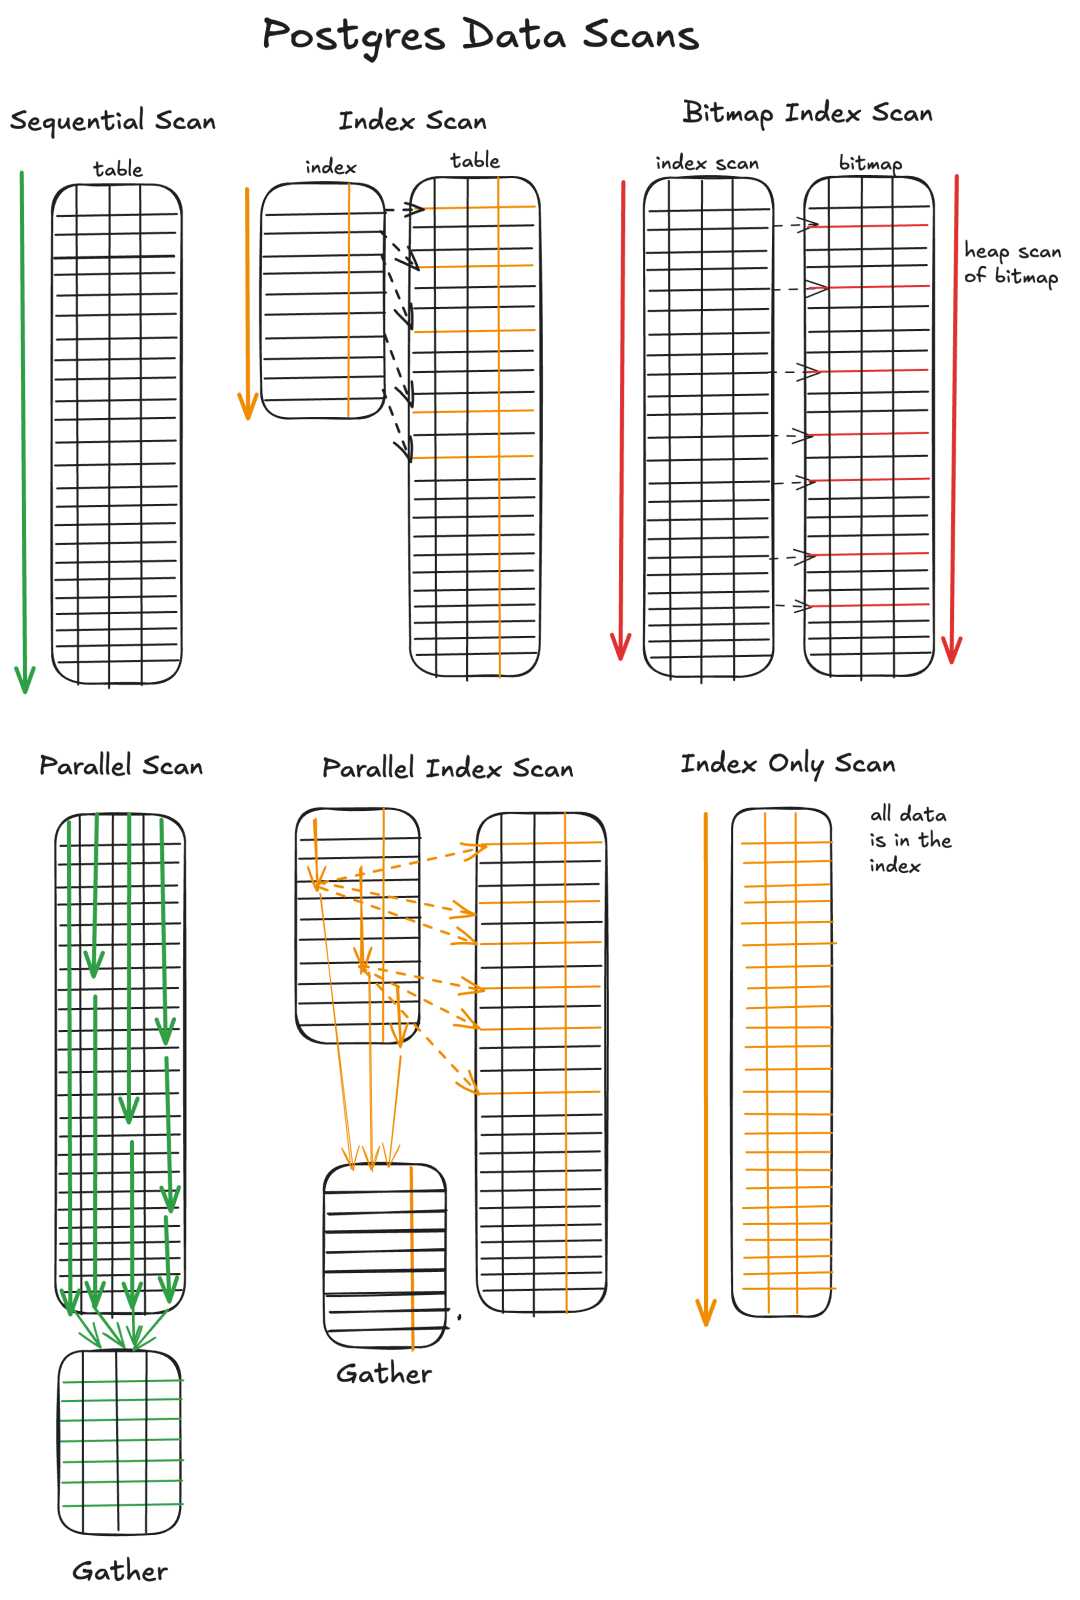
Seq scan(顺序扫描) :Postgres 按顺序查看整个表以查找查询数据。Index scan(索引扫描) :Postgres 首先查看索引,然后获取索引指向的行数据。Bitmap index scan(位图索引扫描) :Postgres 首先读取索引并创建了一个匹配行的位图列表。其次,Postgres 使用位图以比顺序扫描更有效的方法读取数据堆(data heap)。Parallel scan(并行扫描) :Postgres 使用多个并行工作进程扫描表,数据在末尾被收集。Parallel index scan(并行索引扫描) :Postgres 使用多个工作进程执行索引扫描,数据在末尾被收集。Index only scan(仅索引扫描) :查询的所有数据都在索引中。
这里有一张图表将所有内容汇总:
本文参与 腾讯云自媒体同步曝光计划,分享自微信公众号。
原始发表:2025-12-26,如有侵权请联系 cloudcommunity@tencent.com 删除
评论
登录后参与评论
推荐阅读
目录
腾讯云开发者

Copyright © 2013 - 2026 Tencent Cloud. All Rights Reserved. 腾讯云 版权所有
深圳市腾讯计算机系统有限公司 ICP备案/许可证号:粤B2-20090059  粤公网安备44030502008569号
腾讯云计算(北京)有限责任公司 京ICP证150476号 | 京ICP备11018762号