
在带有行图的海运FacetGrid中使用单元
在带有行图的海运FacetGrid中使用单元
提问于 2019-03-11 14:31:56
下面是一个用于解决我的问题的最小、完整和可验证的玩具数据集:
genes = pd.Series(["Gene1"] * 16 + ["Gene2"] * 16)
conditions = pd.Series(np.tile(np.array(["Condition1"] * 8 + ["Condition2"] * 8), 2))
wellID = pd.Series(np.array(["W1"] * 4 + ["W2"] * 4 + ["W3"] * 4 + ["W4"] * 4 + ["W5"] * 4 + ["W6"] * 4 + ["W7"] * 4 + ["W8"] * 4))
fluo = pd.Series(np.array([np.sort(np.random.logistic(size=4)) for _ in range(8)]).flatten())
cycles = pd.Series(np.tile(np.array([0, 1, 2, 3]), 8))
df = pd.concat([genes, conditions, wellID, cycles, fluo], axis=1)
df.columns = ["Gene", "Condition", "WellID", "Cycle", "Fluo"]
它由2个条件下的2个基因组成,每个重复2个重复(1个复制有1个唯一的WellID,其中有4个循环,每个循环有1个测氟点)。
我能够创建我想要用这个命令分离一个基因的线状图:
sns.lineplot(x="Cycle", y="Fluo", hue="Condition", units="WellID", estimator=None, data=df.loc[df.Gene == "Gene1"])我必须同时使用单位和估计器,这样我才能看到这两个副本(而不是每个基因/条件下的聚合曲线)。
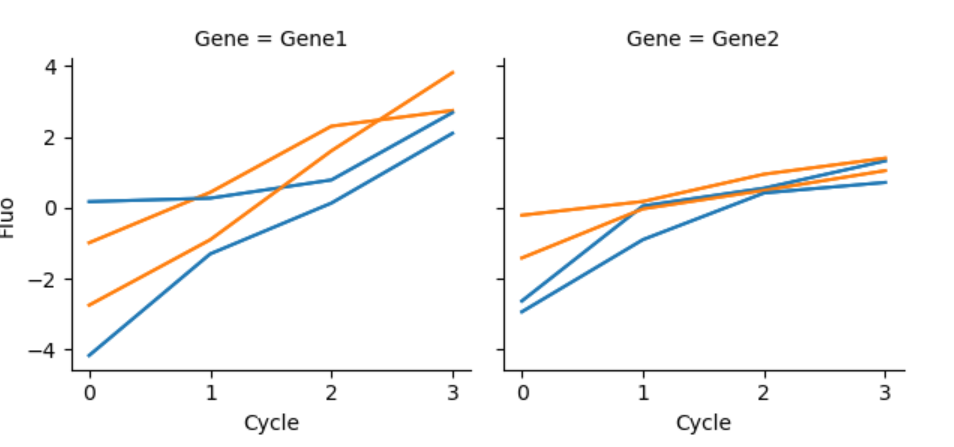
最后,我想使用FacetGrid来查看这两个基因的图,所以我做到了:
g = sns.FacetGrid(df, col="Gene", hue="Condition", col_wrap=5)
g.map(sns.lineplot, "Cycle", "Fluo");但是,如果我有关键字“单位”和“估计器”,我在说"ValueError:无法解释输入'WellID'“时会出错。
我只能显示两个复制聚合的地块。
回答 1
Stack Overflow用户
回答已采纳
发布于 2019-05-21 13:53:02
将其作为args传递给lineplot函数。
g = sns.FacetGrid(df, col="Gene", hue="Condition", col_wrap=5)
g.map(sns.lineplot, "Cycle","Fluo", "WellID")
plt.show()
页面原文内容由Stack Overflow提供。腾讯云小微IT领域专用引擎提供翻译支持
原文链接:
https://stackoverflow.com/questions/55104176
复制相关文章
相似问题
腾讯云开发者

Copyright © 2013 - 2026 Tencent Cloud. All Rights Reserved. 腾讯云 版权所有
深圳市腾讯计算机系统有限公司 ICP备案/许可证号:粤B2-20090059 ![]() 粤公网安备44030502008569号
粤公网安备44030502008569号
腾讯云计算(北京)有限责任公司 京ICP证150476号 | 京ICP备11018762号