
在运行时更改角度NG2的背景点颜色-图表/图表
在运行时更改角度NG2的背景点颜色-图表/图表
提问于 2018-12-07 10:26:19
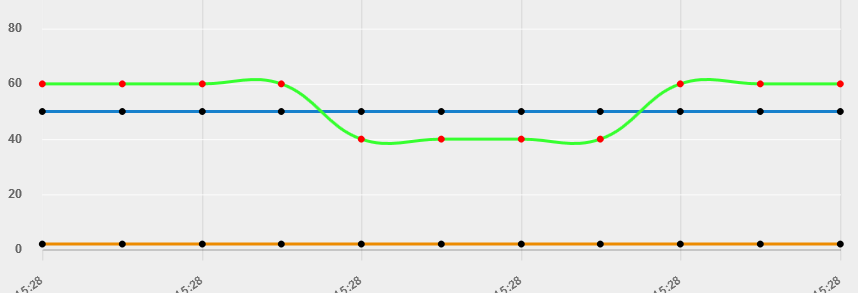
我在我的应用程序中添加了chartjs &希望在运行时根据条件更改特定的点背景色。我能够正确地绘制图表,但不知道如何改变绘图颜色。
从chartjs文档中,我知道我们可以使用pointBackgroundColor来完成,但是所有的在线示例都是设计时示例。
我尝试过使用this._chart.chart.data.datasets[0].pointBackgroundColor = "red";,但是它改变为所有点,而不是特定点。
我的版本:
角ver 6
图表版本2.7.3
NG2-图表1.6.0
Component.ts代码
@ViewChild(BaseChartDirective) public _chart: BaseChartDirective;

constructor(private router: Router, private _realtimeData  : RealtimeDataService) {
 this._realtimeData.getRealtimeData(1)).subscribe(data =>
{
for (let stat of data)
{
    this.labels.push(newDate(stat.DateTime).toLocaleDateString('de-IN', this.options));

    this.datasets_lines[0].data.push(stat.value);
    this.datasets_lines[1].data.push(stat.value1);
    this.datasets_lines[2].data.push(stat.vlue2);

    if ((stat.value > stat.value1) || (stat.value< stat.vlue2))
    {
    this._chart.chart.data.datasets[0].pointBorderColor = "red";
    }
    else
    {
    this._chart.chart.data.datasets[0].pointBorderColor = "black";
    }

    this._chart.chart.update();
}
}
}

public chartColors: Array<any> = [
  { // first color
    borderColor: "#36ff2f",
    pointBackgroundColor: 'rgba(225,10,24,0.2)',
    pointBorderColor: '#fff',
  },

  { // first color
    borderColor: '#1780cc',
    pointBackgroundColor: 'rgba(225,10,24,0.2)',
    pointBorderColor: '#fff',

  },

  { // second color
    borderColor: '#ed8b00',
    pointBackgroundColor: 'rgba(225,10,24,0.2)',
    pointBorderColor: '#fff',
  }];
HTML代码
<canvas
      #mylinechart
      baseChart
      [chartType]="'line'"
      [datasets]="datasets_lines"
      [labels]="labels"
      [options]="chartOptions"
      [legend]="true"
      [colors]="chartColors"
</canvas>回答 2
Stack Overflow用户
发布于 2018-12-07 11:46:29
我认为您可以直接修改这个变量chartColors,然后得到输出。
if (true)
{
  this.chartColors[0].pointBorderColor = "red";
}Stack Overflow用户
发布于 2022-02-09 12:25:27
你试过使用ngZone吗?
mport { NgZone } from '@angular/core';

ngZone.run(() => {
      if (true)
      {
          this.chartColors[0].pointBorderColor = "red";
      }
});页面原文内容由Stack Overflow提供。腾讯云小微IT领域专用引擎提供翻译支持
原文链接:
https://stackoverflow.com/questions/53667631
复制相关文章
相似问题
腾讯云开发者

Copyright © 2013 - 2026 Tencent Cloud. All Rights Reserved. 腾讯云 版权所有
深圳市腾讯计算机系统有限公司 ICP备案/许可证号:粤B2-20090059 ![]() 粤公网安备44030502008569号
粤公网安备44030502008569号
腾讯云计算(北京)有限责任公司 京ICP证150476号 | 京ICP备11018762号