
累积数据及用gnu图进行外推
具有不一定按日期排序的日期和事件列表,例如
# Date     Event
04.12.2018 -4
23.06.2018 5
04.10.2018 3
11.11.2018 -9
08.03.2018 -4
08.03.2018 2
11.11.2018 -3
我想总结这些事件,并进行(例如线性)外推,例如当数据达到某一阈值(例如零)。
看起来smooth frequency和smooth cumulative似乎就是为此而设计的。但我正在与以下几个方面进行斗争:
( a)如何添加开始值(偏移),例如StartValue = 500
plot $Data u (strftime("%d.%m.%Y",timecolumn(1,"%d.%m.%Y"))):($2+StartValue) smooth cumulative w l t "Cumulated Events"
不会那么做的。
( b)如何获得累积数据?尤其是如果数据没有按日期排序?
set table "DataCumulative.dat"
    plot $Data u (strftime("%d.%m.%Y",timecolumn(1,"%d.%m.%Y"))):2 smooth cumulative with table
unset table这看起来类似于这个问题(GNUPLOT: saving data from smooth cumulative),但我没有得到预期的数字。在我下面的例子中,在文件"DataCumulative.dat"中,我期望得到唯一的日期,基本上是从较低的地方获得的数据。怎么弄到这个?
守则:
### start code
reset session
set colorsequence classic
# function for creating a random date between two dates
t(date_str) = strptime("%d.%m.%Y", date_str)
date_random(d0,d1) = strftime("%d.%m.%Y",rand(0)*(t(d1)-t(d0)) + t(d0))
# create some random date data
date_start = "01.01.2018"
date_end = "30.06.2018"
set print $Data
do for [i=1:1000] {
print sprintf("%s\t%g", date_random(date_start,date_end), floor(rand(0)*10-6))
}
set print
set xdata time
set timefmt "%d.%m.%Y"
set xtics format "%b"
set xrange[date_start:"31.12.2018"]
set multiplot layout 2,1
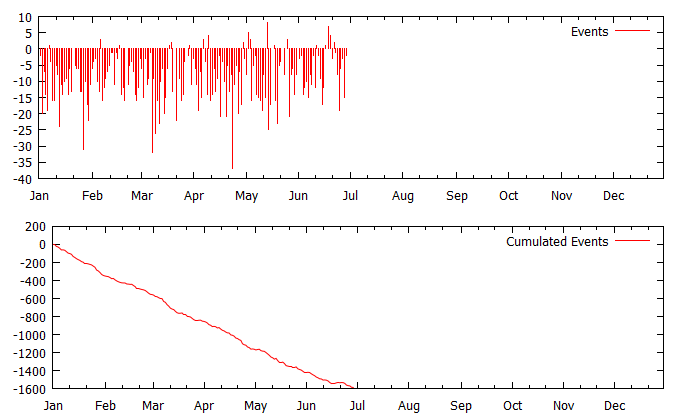
plot $Data u (strftime("%d.%m.%Y",timecolumn(1,"%d.%m.%Y"))):2 smooth frequency with impulses t "Events"
plot $Data u (strftime("%d.%m.%Y",timecolumn(1,"%d.%m.%Y"))):2 smooth cumulative w l t "Cumulated Events"
unset multiplot
# attempt to get cumulative data into datablock
set table "DataCumulative.dat"
plot $Data u (strftime("%d.%m.%Y",timecolumn(1,"%d.%m.%Y"))):2 smooth cumulative with table
unset table
### end of code情节:
回答 1
Stack Overflow用户
发布于 2018-12-02 12:43:15
我想我终于拿到了。然而,有一些学习,我仍然不完全理解。
- 为了获得累积数据,不应该设置
set table $DataCumulative
    plot $Data u (stringcolumn(1)):2 smooth cumulative with table
unset table
但相反:
set table $DataCumulative
    plot $Data u (stringcolumn(1)):2 smooth cumulative
unset table请注意绘图命令中缺少的"with table“。第一个版本提供原始数据,第二个版本提供所需的累积数据。但我还不明白为什么。
- 默认的数据文件分隔符设置,它是
set datafile separator whitespace它似乎不起作用。它将给出类似于line xxx: No data to fit的错误消息。
相反,你必须设置
set datafile separator " \t" # space and TAB但我不明白为什么。
- 拟合时间日期
f_lin(x) = m*x + c一点也不适合。显然,你必须减去开始的日期,并进行拟合。
f_lin(x) = m*(x-strptime("%d.%m.%Y", Date_Start)) + c我还记得很久以前在gnuplot文档中读过,但是我再也找不到了。
就目前而言,我现在对以下几点感到满意。
修改后的代码:
### generate random date between two dates
reset session
# function for creating a random date between two dates
t(date_str) = strptime("%d.%m.%Y", date_str)
date_random(d0,d1) = strftime("%d.%m.%Y",rand(0)*(t(d1)-t(d0)) + t(d0))
# create some random date data
Date_Start = "01.01.2018"
Date_End = "30.06.2018"
set print $Data
do for [i=1:100] {
print sprintf("%s\t%g", date_random(Date_Start,Date_End), floor(rand(0)*10-6))
}
set print
set xdata time
set timefmt "%d.%m.%Y"
# get cumulative data into datablock
set xtics format "%d.%m.%Y"
set table $DataCumulative
plot $Data u (stringcolumn(1)):2 smooth cumulative
unset table
set xtics format "%b"
set datafile separator " \t" # space and TAB
# linear function and fitting
f_lin(x) = m*(x-strptime("%d.%m.%Y", Date_Start)) + c
set fit nolog quiet
fit f_lin(x) $DataCumulative u 1:2 via m,c
Level_Start = 500
Level_End = 0
x0 = (Level_End - Level_Start - c)/m + strptime("%d.%m.%Y", Date_Start)
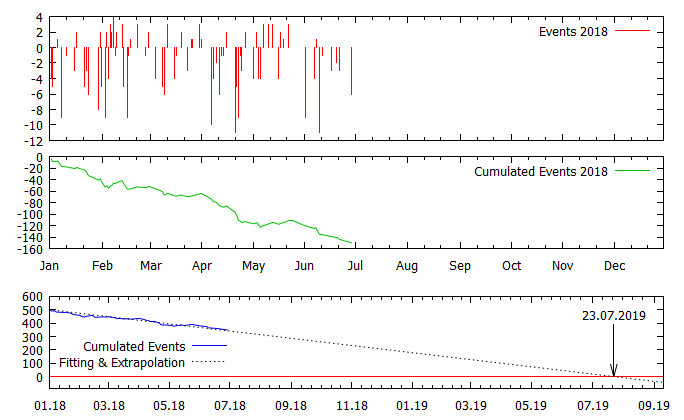
set multiplot layout 3,1
# event plot & cumulative plot
set xrange[Date_Start:"31.12.2018"]
set xtics format ""
set lmargin 7
set bmargin 0
plot $Data u (timecolumn(1,"%d.%m.%Y")):2 smooth frequency with impulses lc rgb "red" t "Events 2018"
set xtics format "%b"
set bmargin
plot $Data u (timecolumn(1,"%d.%m.%Y")):2 smooth cumulative w l lc rgb "web-green" t "Cumulated Events 2018"
# fit & extrapolation plot
set label 1 at x0, graph 0.8 strftime("%d.%m.%Y",x0) center
set arrow 1 from x0, graph 0.7 to x0, Level_End
set key at graph 0.30, graph 0.55
set xrange[Date_Start:x0+3600*24*50] # end range = extrapolated date + 50 days
set xtics format "%m.%y"
set yrange [-90:]
plot $DataCumulative u (timecolumn(1,"%d.%m.%Y")):($2+Level_Start) w l lc rgb "blue" t "Cumulated Events",\
Level_End w l lc rgb "red" not,\
f_lin(x)+Level_Start w l ls 0 t "Fitting \\& Extrapolation"
unset multiplot
### end of code将导致:
https://stackoverflow.com/questions/53558780
复制相似问题
腾讯云开发者

Copyright © 2013 - 2026 Tencent Cloud. All Rights Reserved. 腾讯云 版权所有
深圳市腾讯计算机系统有限公司 ICP备案/许可证号:粤B2-20090059 ![]() 粤公网安备44030502008569号
粤公网安备44030502008569号
腾讯云计算(北京)有限责任公司 京ICP证150476号 | 京ICP备11018762号