
平日名称中的X轴
我看过这些文档,但他们似乎没有提到。
如何更改x轴上的标签以显示“Mon 20-7”、“Tue 21-7”等。xaxis使用的“日期”格式为"20-7-2018 11:00:00 in“等。
我使用以下Python脚本:
trace0=go.Scatter(x=df_pre.index,y=df_pre['Total'],line=dict(color=('rgb(16,25,109)'),width=1),name='Period_1')

trace1=go.Scatter(x=df_post.index,y=df_post['Total'],line=dict(color=('rgb(77,221,26)'),width=2),name='Period_2')

data=[trace0,trace1]

layout=dict(title='Total',width=960,height=768,
              yaxis=dict(title='Avg',ticklen=5,zeroline=False,gridwidth=2,),
              xaxis=dict(title='Date',ticklen=5,zeroline=False,gridwidth= 2,))

fig=dict(data=data,layout=layout)

iplot(fig,filename='Total')
任何帮助都将不胜感激。
回答 2
Stack Overflow用户
发布于 2018-08-18 11:04:58
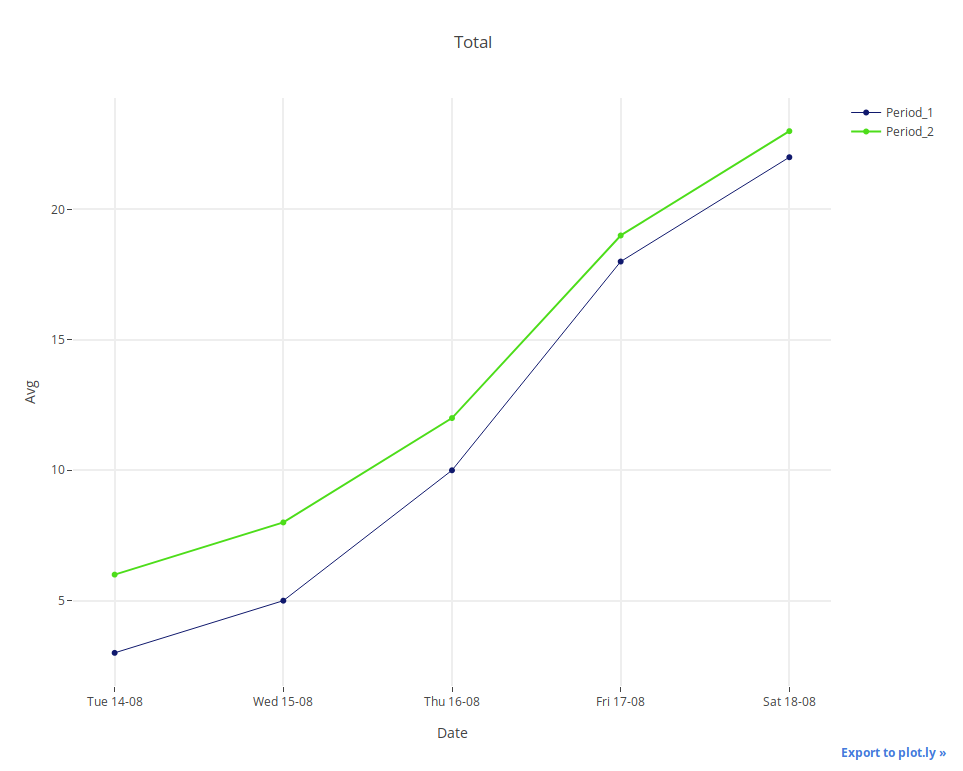
如果您想在xaxis上看到"Tue 14-08“,请执行以下步骤(在下面的代码中添加):
1.创建一个符合您的要求的列
df_pre["date2"] = df_pre["date"].apply(lambda x: datetime.datetime.\
                strptime(x,"%d-%m-%Y %I:%M:%S%p").strftime("%a %d-%m"))
print(df_pre["date2"])
0    Tue 14-08
1    Wed 15-08
2    Thu 16-08
3    Fri 17-08
4    Sat 18-08
Name: date2, dtype: object
2.从列中创建一个名为“list_”的列表,它看起来像是您希望在xaxis (df_pre["date2"])上看到的
list_ = df_pre["date2"].tolist()
print(list_)
['Tue 14-08', 'Wed 15-08', 'Thu 16-08', 'Fri 17-08', 'Sat 18-08']
3.在xaxis Layout中放入两个参数tickvals和ticktext:在第一个参数中,要迭代多少个值。在第二个参数中,选择文本(例如我们从列list_获得的文本)
layout=dict(title="Total",width=960,height=768,
            yaxis=dict(title="Avg",ticklen=5,zeroline=False,gridwidth=2),
            xaxis=dict(title="Date",ticklen=5,zeroline=False,gridwidth=2,
                       #Choose what you want to see on xaxis! In this case list_
                       tickvals=[i for i in range(len(list_))],
                       ticktext=list_
                       ))
输出应该是这样的:
我在文件中找不到选择,那就是你的需要。但是请不要忘记,您可以使用x和pandas来准备您之后可以输入的数据。
#Import all what we need
import pandas as pd
import plotly
import plotly.graph_objs as go
#Create first DataFrame
df_pre = pd.DataFrame({"date":["14-08-2018 11:00:00am",
                               "15-08-2018 12:00:00am",
                               "16-08-2018 01:00:00pm",
                               "17-08-2018 02:00:00pm",
                               "18-08-2018 03:00:00pm"],
                       "number":["3","5","10","18","22"]})
#Create a column which corresponds to your requirements
df_pre["dow"] = pd.to_datetime(df_pre["date"], \
                               format="%d-%m-%Y %I:%M:%S%p").dt.weekday_name
df_pre["firstchunk"] = df_pre["dow"].astype(str).str[0:3]
df_pre["lastchunk"] = df_pre["date"].astype(str).str[0:5]
df_pre["final"] = df_pre["firstchunk"] + " " + df_pre["lastchunk"]
#Check DataFrame
print(df_pre)
#Repeat all the actions above to the second DataFrame
df_post = pd.DataFrame({"date":["14-08-2018 11:00:00am",
                                "15-08-2018 12:00:00am",
                                "16-08-2018 01:00:00pm",
                                "17-08-2018 02:00:00pm",
                                "18-08-2018 03:00:00pm"],
                        "number":["6","8","12","19","23"]})
df_post["dow"] = pd.to_datetime(df_post["date"], \
                                format="%d-%m-%Y %I:%M:%S%p").dt.weekday_name
df_post["firstchunk"] = df_post["dow"].astype(str).str[0:3]
df_post["lastchunk"] = df_post["date"].astype(str).str[0:5]
df_post["final"] = df_post["firstchunk"] + " " + df_post["lastchunk"]
print(df_post)
#Create list needed for xaxis
list_ = df_pre["final"].tolist()
print(list_)
#Prepare data
trace0=go.Scatter(x=df_pre["date"],y=df_pre["number"],
                  line=dict(color=("rgb(16,25,109)"),width=1),name="Period_1")
trace1=go.Scatter(x=df_post["date"],y=df_post["number"],
                  line=dict(color=("rgb(77,221,26)"),width=2),name="Period_2")
data = [trace0,trace1]
#Prepare layout
layout=dict(title="Total",width=960,height=768,
            yaxis=dict(title="Avg",ticklen=5,zeroline=False,gridwidth=2),
            xaxis=dict(title="Date",ticklen=5,zeroline=False,gridwidth=2,
                       #Choose what you want to see on xaxis! In this case list_
                       tickvals=[i for i in range(len(list_))],
                       ticktext=list_
                       ))
fig = go.Figure(data=data, layout=layout)
#Save plot as "Total.html" in directory where your script is
plotly.offline.plot(fig, filename="Total.html", auto_open = False)更新:--您也可以尝试使用datetime来实现您想要的(这更简单):
#Import all what we need
import pandas as pd
import plotly
import plotly.graph_objs as go
import datetime
#Create first DataFrame
df_pre = pd.DataFrame({"date":["14-08-2018 11:00:00am",
                               "15-08-2018 12:00:00am",
                               "16-08-2018 01:00:00pm",
                               "17-08-2018 02:00:00pm",
                               "18-08-2018 03:00:00pm"],
                       "number":["3","5","10","18","22"]})
#Create a column which corresponds to your requirements
df_pre["date2"] = df_pre["date"].apply(lambda x: datetime.datetime.\
            strptime(x,"%d-%m-%Y %I:%M:%S%p").strftime("%a %d-%m"))
#Check DataFrame
print(df_pre)
#Repeat all the actions above to the second DataFrame
df_post = pd.DataFrame({"date":["14-08-2018 11:00:00am",
                                "15-08-2018 12:00:00am",
                                "16-08-2018 01:00:00pm",
                                "17-08-2018 02:00:00pm",
                                "18-08-2018 03:00:00pm"],
                        "number":["6","8","12","19","23"]})
df_post["date2"] = df_post["date"].apply(lambda x: datetime.datetime.\
             strptime(x,'%d-%m-%Y %I:%M:%S%p').strftime("%a %d-%m"))
print(df_post)
#Create list that needed to xaxis
list_ = df_pre["date2"].tolist()
print(list_)
#Prepare data
trace0=go.Scatter(x=df_pre["date"],y=df_pre["number"],
                  line=dict(color=("rgb(16,25,109)"),width=1),name="Period_1")
trace1=go.Scatter(x=df_post["date"],y=df_post["number"],
                  line=dict(color=("rgb(77,221,26)"),width=2),name="Period_2")
data = [trace0,trace1]
#Prepare layout
layout=dict(title="Total",width=960,height=768,
            yaxis=dict(title="Avg",ticklen=5,zeroline=False,gridwidth=2),
            xaxis=dict(title="Date",ticklen=5,zeroline=False,gridwidth=2,
                       #Choose what you want to see on xaxis! In this case list_
                       tickvals=[i for i in range(len(list_))],
                       ticktext=list_
                       ))
fig = go.Figure(data=data, layout=layout)
#Save plot as "Total.html" in directory where your script is
plotly.offline.plot(fig, filename="Total.html")Stack Overflow用户
发布于 2018-08-17 07:19:13
你可以这样做:-
data = [go.Scatter(x=df.Date, y=df.High)]要获得更多参考,可以参考以下链接:- https://plot.ly/python/time-series/
学习愉快!
https://stackoverflow.com/questions/51889943
复制相似问题
腾讯云开发者

Copyright © 2013 - 2026 Tencent Cloud. All Rights Reserved. 腾讯云 版权所有
深圳市腾讯计算机系统有限公司 ICP备案/许可证号:粤B2-20090059 ![]() 粤公网安备44030502008569号
粤公网安备44030502008569号
腾讯云计算(北京)有限责任公司 京ICP证150476号 | 京ICP备11018762号