
treemap 4树图气球
treemap 4树图气球
提问于 2018-07-05 17:49:34
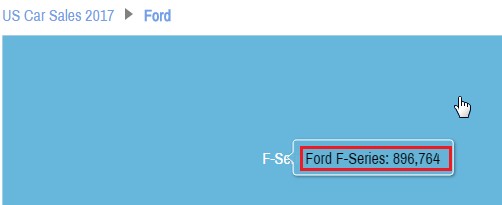
如何从图4中更改树状图上气球中的文本/样式?
在下面的示例中,如何从气球中删除"Ford“?
回答 1
Stack Overflow用户
发布于 2018-10-18 01:07:17
对于这个超晚的答案,我诚恳地表示歉意,这个问题最近又出现在另一个问题上,不知道这个问题是如何从裂缝中溜走的。
这是一个很好的问题,至少有两个原因:
- 当时我们还没有修改工具提示背景色指南。
TreeMap图表与其他图表不同,我们没有直接使用实际的TreeMapSeries。
如果您只是想编辑工具提示的文本,我们可以通过TreeMapSeries template进行编辑,特别是在它的列模板(即columns.template.tooltipText,例如使用作为基础的原始演示 )上
// The default `tooltipText` for all columns, e.g.
// `chart.series.getIndex(0).columns.template.tooltip`, is
// `"{parentName} {name}: {value}"`
//
// Let's keep {parentName} on a separate line in `tooltipText`, and play with
// font size, colors, and style. (Note we cannot nest formatting brackets.)
//
// More on string and visual formatting:
// https://www.amcharts.com/docs/v4/concepts/formatters/formatting-strings/
level1SeriesTemplate.columns.template.tooltipText =
"[bold font-size: 22px; #fff]{parentName}[/]\n[font-size: 20px]{name}:[/] [font-size: 20px #fff]{value}[/]";但是,如果您想要做的更多,例如修改背景,您将需要处理实际列本身,因为实际的工具提示对象在列模板上不可用。下面是一种为TreeMapSeries和他们的columns做好准备的方法:
// Looking over this chart type, i.e. TreeMap, we find it has a
// seriesContainer property:
// https://www.amcharts.com/docs/v4/reference/treemap/#seriesContainer_property
//
// and all containers have a "childadded" event:
// https://www.amcharts.com/docs/v4/reference/container/#childadded_event
//
// which works just as expected.
//
// More on events here:
// https://www.amcharts.com/docs/v4/concepts/event-listeners/
chart.seriesContainer.events.on("childadded", function(event) {
  // The chart will load with the initial series at first,
  // we're not interested in that.
  if (chart.series.length === 1) return;

  // Once we click a car company / TreeMap column, a new series will be generated
  // and added to the seriesContainer. Here, event.target will be the seriesContainer,
  // and event.newValue will always be the new TreeMapSeries.
  var series = event.newValue;

  // level-/depth-specific code, if you wanted
  // if (series.level === 1) {
  // }

  // The series exists, but is not ready/populated yet. In general, datavalidated
  // is a good event to check against for initial load/readiness of a series.
  series.events.once("datavalidated", function() {
    series.columns.each(function(column) {
      // In order to customize tooltip colors, we need to set getFillFromObject to false,
      // otherwise as it sounds, it'll grab color data from the parent object.
      // https://www.amcharts.com/docs/v4/reference/tooltip/#getFillFromObject_property
      // https://www.amcharts.com/docs/v4/reference/tooltip/#getStrokeFromObject_property
      column.tooltip.getFillFromObject = false;
      // column.tooltip.getStrokeFromObject = false; // not needed, since it defaults to false
      column.tooltip.background.stroke = am4core.color("#fff");
      column.tooltip.background.strokeWidth = 3;
      column.tooltip.background.strokeOpacity = 0.3;

      // background of tooltip, let's make it darker than the column's bg.
      column.tooltip.background.fill = am4core.color(
        am4core.colors.brighten(column.fill.rgb, -0.3)
      );
      // let's also make it slightly transparent.
      column.tooltip.background.fillOpacity = 0.8;

      // tooltip text color, we can also set this via string visual formatting,
      // see `tooltipText` assignment further below.
      // Every Tooltip has a Label:
      // https://www.amcharts.com/docs/v4/reference/tooltip/#label_property
      // https://www.amcharts.com/docs/v4/reference/label/
      //
      // Let's make the default color brighter than the column bg color.
      column.tooltip.label.fill = am4core.color(
        am4core.colors.brighten(column.fill.rgb, 0.7)
      );
      // alignment of text within tooltip (cannot use string visual formatting for this).
      // Let's center the text, mainly the title/parent company.
      column.tooltip.label.textAlign = "middle";
    });
  });
});
我在这里准备了一个演示:
https://codepen.io/team/amcharts/pen/07c3ca3e33b4ad955246893d19df3a6c/
希望这涵盖了你可能对修改感兴趣的内容。
页面原文内容由Stack Overflow提供。腾讯云小微IT领域专用引擎提供翻译支持
原文链接:
https://stackoverflow.com/questions/51197282
复制相关文章
相似问题
腾讯云开发者

Copyright © 2013 - 2026 Tencent Cloud. All Rights Reserved. 腾讯云 版权所有
深圳市腾讯计算机系统有限公司 ICP备案/许可证号:粤B2-20090059 ![]() 粤公网安备44030502008569号
粤公网安备44030502008569号
腾讯云计算(北京)有限责任公司 京ICP证150476号 | 京ICP备11018762号