
叠加杆的奇序
叠加杆的奇序
提问于 2017-06-06 12:36:40
我正在尝试创建一个像这里这样的不同的堆叠条,并且正在经历一个类似于这个所以问题的问题。不过,我的方法略有不同,因为我是通过一个数据集(而不是两个数据集)来管理它的,而且我的颜色与我的数据无关。
Reprex如下:
library(tidyverse)
library(RColorBrewer)
x <- tribble(
  ~response, ~count,
  0,         -27,
  1,          -9,
  2,         -41,
  3,         -43,
  4,         -58,
  5,        -120,
  5,         120,
  6,         233,
  7,         379,
  8,         388,
  9,         145,
  10,         61
) %>%
  mutate(response = factor(response))

ggplot(x, aes(x = 1, y = count, fill = response)) +
  geom_col() +
  scale_fill_brewer(palette = "RdBu") +
  coord_flip()
这给了我一个像这样的图像:
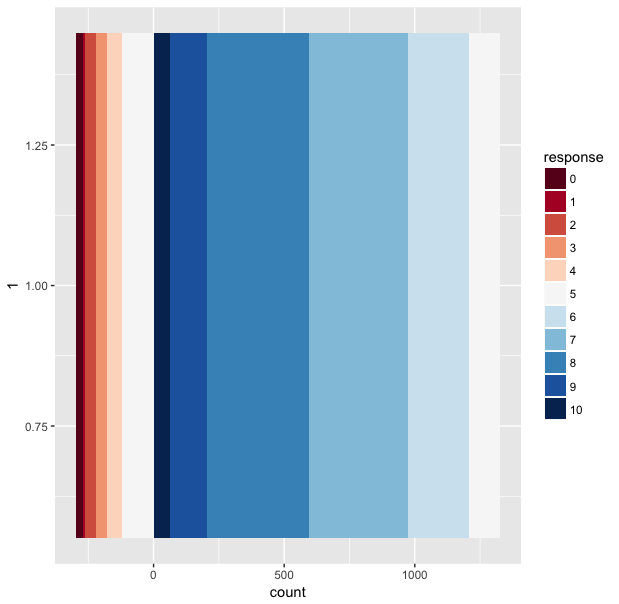
这个问题与零位的右边堆叠数据的顺序有关,在那里堆叠的数据似乎是降序的。任何关于如何解决这一问题的想法都将受到极大的赞赏(预期的订购将是0-10,而不是0-5,10-5)。
回答 3
Stack Overflow用户
回答已采纳
发布于 2017-06-06 15:43:25
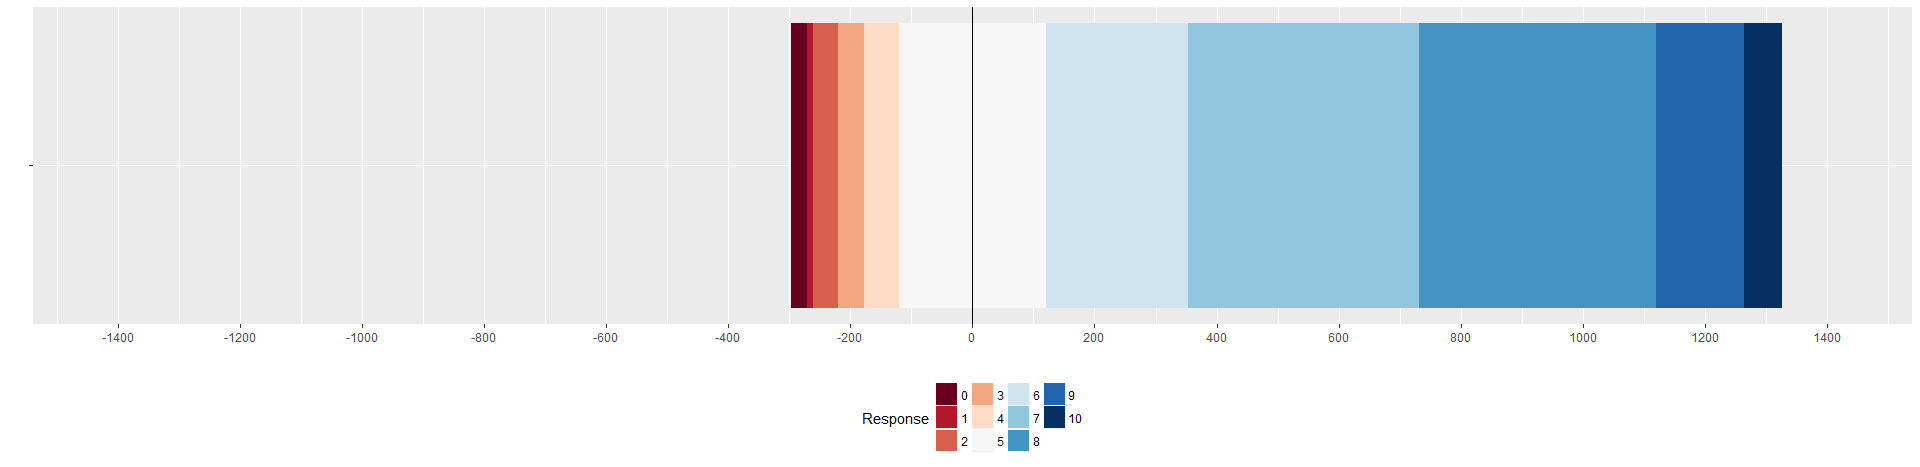
很难对付!我玩有序化,geom_bar和geom_col似乎不喜欢以相同的顺序组合正负值。因此,我将数据划分为数据中的正值和负值,为每个响应值生成颜色,并将两个geoms分别用于正负值:
library(tidyverse)
library(RColorBrewer)
x <- tribble(
  ~response, ~count,
  0,         -27,
  1,          -9,
  2,         -41,
  3,         -43,
  4,         -58,
  5,        -120,
  5,         120,
  6,         233,
  7,         379,
  8,         388,
  9,         145,
  10,         61
) %>%
  # Get absolute values and add dummy to distuingish positive and negative values
  mutate(subzero = count < 0,
         count = abs(count))

# Generate variable with colors from ColorBrewer for every response level (ugly but works)
colors <- brewer.pal(length(unique(x$response)),"RdBu")
x$colors <- NA
for (i in 1:nrow(x)){
  x$colors[i] <- colors[x$response[i]+1]
}


ggplot() +
  geom_bar(data = x[x$subzero==T,], aes(x = "", y = -count, fill = reorder(colors, response)), position="stack", stat="identity") +
  geom_bar(data = x[x$subzero==F,], aes(x = "", y = count, fill = reorder(colors, -response)), position="stack", stat="identity") +
  geom_hline(yintercept = 0, color =c("black")) +
  scale_fill_identity("Response", labels = unique(x$response), breaks=unique(x$colors), guide="legend") +
  coord_flip() +
  labs(y="",x="") +
  theme(legend.position = "bottom", legend.direction = "horizontal") +
  scale_y_continuous(breaks=seq(-1400,1400,200), limits=c(-1400,1400))
UPD:使Y级平衡,看上去更清晰
Stack Overflow用户
发布于 2017-06-06 12:53:05
虽然不直观(对我来说),但请使用:
ggplot(x, aes(x = 1, y = order(count), fill = response)) +
  geom_col() +
  scale_fill_brewer(palette = "RdBu",direction=1) +
  coord_flip()
它考虑到基于响应的排序(而不是订单(响应))
Stack Overflow用户
发布于 2017-06-06 15:36:44
您可以使用position_stack(reverse=TRUE)
ggplot(x, aes(x = 1, y = count, fill = response)) +
  geom_col(position = position_stack(reverse=TRUE)) +
  scale_fill_brewer(palette = "RdBu") +
coord_flip()页面原文内容由Stack Overflow提供。腾讯云小微IT领域专用引擎提供翻译支持
原文链接:
https://stackoverflow.com/questions/44390199
复制相关文章
相似问题
腾讯云开发者

Copyright © 2013 - 2026 Tencent Cloud. All Rights Reserved. 腾讯云 版权所有
深圳市腾讯计算机系统有限公司 ICP备案/许可证号:粤B2-20090059 ![]() 粤公网安备44030502008569号
粤公网安备44030502008569号
腾讯云计算(北京)有限责任公司 京ICP证150476号 | 京ICP备11018762号