
画半条无限线?
我使用pyqtgraph进行数据采集,并且必须表示图形视图上的一些阈值。例如,为了表示高电压限制,我使用了pyqtgraph中的InfiniteLine类,但是现在,我必须考虑到在获取过程中阈值可能发生的一些变化。它看起来像是在两条无限线之间的一步(请找一个附加的例子)。
示例
为此,我必须画一条半无限的线。你知道一个简单的方法吗?
我考虑使用受plotCurveItem最小值和最大值限制的一些viewBox:
thresholdValue = 60V # just an example
range = self.viewBox.viewRange()
xRange = range[0]   # we only want ViewBox horizontal limits
minView = xRange[0]
maxView = xRange[1]
myPlotCurveItem = pyqtgraph.PlotCurveItem([minView, maxView],[thresholdValue, thresholdValue])
如果在临界值上发生变化:
newThresholdValue = 70VplotCurveItem的x数据将变成:
[minView, changingTime] #with changinTime : the moment we change the threshold我们将添加一个新的plotCurveItem:
myNewPlotCurveItem = pyqtgraph.plotCurveItem([changingTime, maxView],[newThresholdValue, newThresholdValue])这个解决方案看上去不错吗?你觉得有什么问题吗?
回答 2
Stack Overflow用户
发布于 2016-06-15 13:06:13
您的方法看起来不错,而且主要是pyqtgraph.InfiniteLine正在做的事情。我检查了InfiniteLine的来源,提取了绝对必要的部分,并添加了变化点和两层信息,然后画出三条线(左边框到左水平变化点,右边界改变点到右边界,两者连接)。
以下是完整的代码:
from pyqtgraph.Qt import QtGui
import numpy as np
import pyqtgraph as pg

class InfiniteLineWithBreak(pg.GraphicsObject):

    def __init__(self, changeX, levelsY, pen=None):
        pg.GraphicsObject.__init__(self)

        self.changeX = changeX
        self.levelsY = levelsY

        self.maxRange = [None, None]
        self.moving = False
        self.movable = False
        self.mouseHovering = False

        pen = (200, 200, 100)
        self.setPen(pen)
        self.setHoverPen(color=(255,0,0), width=self.pen.width())
        self.currentPen = self.pen


    def setBounds(self, bounds):
        self.maxRange = bounds
        self.setValue(self.value())

    def setPen(self, *args, **kwargs):
        self.pen = pg.fn.mkPen(*args, **kwargs)
        if not self.mouseHovering:
            self.currentPen = self.pen
            self.update()

    def setHoverPen(self, *args, **kwargs):
        self.hoverPen = pg.fn.mkPen(*args, **kwargs)
        if self.mouseHovering:
            self.currentPen = self.hoverPen
            self.update()

    def boundingRect(self):
        br = self.viewRect()
        return br.normalized()

    def paint(self, p, *args):
        br = self.boundingRect()
        p.setPen(self.currentPen)
        # three lines (left border to change point, change point vertical, change point to right)
        p.drawLine(pg.Point(br.left(), self.levelsY[0]), pg.Point(self.changeX, self.levelsY[0]))
        p.drawLine(pg.Point(self.changeX, self.levelsY[0]), pg.Point(self.changeX, self.levelsY[1]))
        p.drawLine(pg.Point(self.changeX, self.levelsY[1]), pg.Point(br.right(), self.levelsY[1]))

    def dataBounds(self, axis, frac=1.0, orthoRange=None):
        if axis == 0:
            return None   ## x axis should never be auto-scaled
        else:
            return (0,0)

    def setMouseHover(self, hover):
        pass

app = QtGui.QApplication([])
w = pg.GraphicsWindow()
w.resize(1000, 600)
v = w.addPlot(y=np.random.normal(size=100))
v.addItem(InfiniteLineWithBreak(changeX=50, levelsY=(-1, 1)))
app.exec_()
看上去:
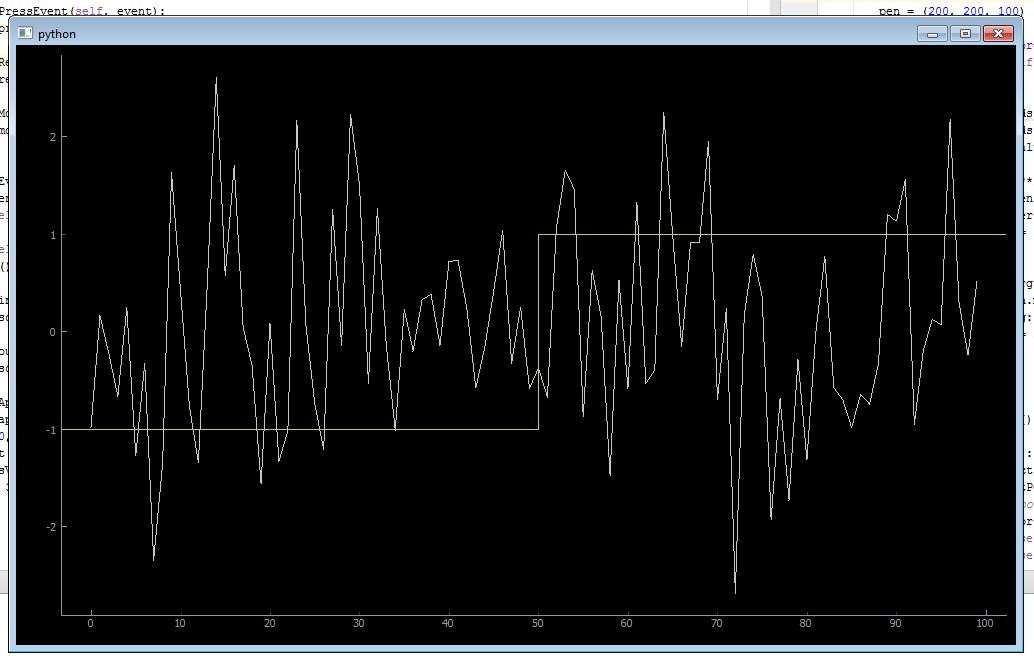
我们可以添加的是对鼠标悬停和改变值的反应(变化点和水平),甚至旋转90度。InfiniteLine是如何做到这一点的一个很好的例子。
Stack Overflow用户
发布于 2016-06-20 12:32:06
谢谢你非常完整的回答!你的代码运行得很好。为了设置多个阈值转换,我对类InfiniteLineWithBreak做了一些修改。我只修改了init和only方法:
def __init__(self, listOfcouplesOfThresholdAndItsDate, pen=None):
    pg.GraphicsObject.__init__(self)

    self.listOfcouplesOfThresholdAndItsDate=listOfcouplesOfThresholdAndItsDate
    self.maxRange = [None, None]
    self.moving = False
    self.movable = False
    self.mouseHovering = False

    pen = (200, 200, 100)
    self.setPen(pen)
    self.setHoverPen(color=(255,0,0), width=self.pen.width())
    self.currentPen = self.pen


 def paint(self, p, *args):
    br = self.boundingRect()
    p.setPen(self.currentPen)
    if len(self.listOfcouplesOfThresholdAndItsDate)==0:
        pass
    elif len(self.listOfcouplesOfThresholdAndItsDate)==1:
        threshold = self.listOfcouplesOfThresholdAndItsDate[0][1]
        date = self.listOfcouplesOfThresholdAndItsDate[0][0]
        p.drawLine(pg.Point(date, threshold), pg.Point(br.right(), threshold))

    else:

        threshold = self.listOfcouplesOfThresholdAndItsDate[0][1]
        date = self.listOfcouplesOfThresholdAndItsDate[0][0]
        i=0
        for i in range(0, len(self.listOfcouplesOfThresholdAndItsDate)-2):
            threshold = self.listOfcouplesOfThresholdAndItsDate[i][1]
            date = self.listOfcouplesOfThresholdAndItsDate[i][0]
            nexteDate = self.listOfcouplesOfThresholdAndItsDate[i+1][0]
            nextThreshold = self.listOfcouplesOfThresholdAndItsDate[i+1][1]
            p.drawLine(pg.Point(date, threshold), pg.Point(nexteDate, threshold))
            p.drawLine(pg.Point(nexteDate, threshold), pg.Point(nexteDate, nextThreshold))


        threshold = self.listOfcouplesOfThresholdAndItsDate[-2][1]
        date = self.listOfcouplesOfThresholdAndItsDate[-2][0]
        nexteDate = self.listOfcouplesOfThresholdAndItsDate[-1][0]
        nextThreshold = self.listOfcouplesOfThresholdAndItsDate[-1][1]
        p.drawLine(pg.Point(date, threshold), pg.Point(nexteDate, threshold))
        p.drawLine(pg.Point(nexteDate, threshold), pg.Point(nexteDate, nextThreshold))

        p.drawLine(pg.Point(nexteDate, nextThreshold), pg.Point(br.right(), nextThreshold))
此外,我还添加了一种方法,将新的阈值转换点附加到listOfcouplesOfThersholdAndItsDate中:
def addANewThreshold(self,date, threshold):
self.listOfcouplesOfThresholdAndItsDate.append((date, threshold))下面是它的外观示例:多阈值实例
你觉得密码还好吗?谢谢,
https://stackoverflow.com/questions/37702642
复制相似问题
腾讯云开发者

Copyright © 2013 - 2026 Tencent Cloud. All Rights Reserved. 腾讯云 版权所有
深圳市腾讯计算机系统有限公司 ICP备案/许可证号:粤B2-20090059 ![]() 粤公网安备44030502008569号
粤公网安备44030502008569号
腾讯云计算(北京)有限责任公司 京ICP证150476号 | 京ICP备11018762号