
Y轴-最小-最大量程-角度NVD3 -线图
Y轴-最小-最大量程-角度NVD3 -线图
提问于 2016-03-09 05:14:28
使用-角NVD3 LineChart
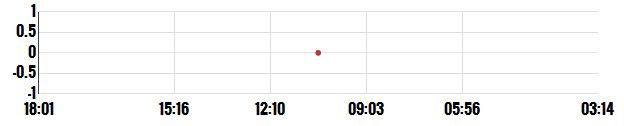
我正在获取数据,但是,当数据为0时,它从范围-1,0,1绘制图和绘制y轴。
但我确实想用负y轴绘制,因为我的数据不可能是负的。
X轴包含时间.
我的图表随着时间的推移而进步,问题就像前几分钟的数据将是0,然后我将开始获取数据。
JavaScript码
$scope.options = {
                        chart: {
                            type: 'lineChart',
                            height: 120,
                            margin : {
                                top: 8,
                                bottom: 30,
                                left:40,
                                right:50,
                            },
                      color: ['#e4a91d','#444fa2','#de0000']
                    , showLegend: false
                    , wrapLabels: true
                    , tooltips:true
                    , reduceXTicks: false,


                            x: function(d){ return d[0]; },
                            y: function(d){ return d[1]; },

                            showDistY: true,
                            showDistX: true,
                            useInteractiveGuideline: true,
                            transitionDuration: 10,

                            xAxis: {
                                axisLabel: '',
                                tickFormat: function(d) {
                                    return d3.time.format('%H:%M')(new Date(d));
                                },
                                tickPadding: 10,
                                axisLabelDistance: 1,
                                ticks: 10,
                            },

                            yAxis: {
                                axisLabel: '1 / 2 / 3',
                                tickFormat: function(d){
                                    return d;
                                },
                                ticks: 4,
                            }
                        }
                    };
Html代码
<div>
    <nvd3 options="options" data="data" api="api"></nvd3>
</div>
截图
回答 1
Stack Overflow用户
回答已采纳
发布于 2016-03-09 16:17:50
我觉得这个应该管用。将这些添加到图表对象yDomain: [0, maxY] // maxY being whatever you want your max y value to be中,我在图表中使用了类似的内容。在这里找到的https://github.com/krispo/angular-nvd3/issues/47
页面原文内容由Stack Overflow提供。腾讯云小微IT领域专用引擎提供翻译支持
原文链接:
https://stackoverflow.com/questions/35883433
复制相关文章
相似问题
腾讯云开发者

Copyright © 2013 - 2026 Tencent Cloud. All Rights Reserved. 腾讯云 版权所有
深圳市腾讯计算机系统有限公司 ICP备案/许可证号:粤B2-20090059 ![]() 粤公网安备44030502008569号
粤公网安备44030502008569号
腾讯云计算(北京)有限责任公司 京ICP证150476号 | 京ICP备11018762号