
RestAngular -角- NVD3 - CumulativeLineChart -绘制y轴和x轴
RestAngular -角- NVD3 - CumulativeLineChart -绘制y轴和x轴
提问于 2015-11-16 11:45:00
我是Restangular的新手,并且使用angular-nvd3图表api。
我有RestService,它以下面的格式返回Json响应。
3在单个图上绘制3条不同的线。
键名,如A,B,C值-毫秒,顺序/秒
X轴- Date (从毫秒转换)
Y轴- orders/sec
JSON
[
    {
        "key": "A",
        "values": [
            [
                1447673334646,
                17
            ],
            [
                1447673634646,
                22
            ],
            [
                1447673694646,
                19
            ],
            [
                1447673754646,
                7
            ],
            [
                1447673814646,
                7
            ],
            [
                1447673874646,
                15
            ],
        ]
    },
    {
        "key": "B",
        "values": [
            [
                1447673334646,
                14
            ],
            [
                1447673694646,
                17
            ],
            [
                1447674054646,
                23
            ]
        ]
    },
    {
        "key": "C",
        "values": [
           [
                1447673694646,
                5
            ],
            [
                1447673754646,
                12
            ],
            [
                1447673814646,
                12
            ],
            [
                1447673994646,
                7
            ],
            [
                1447674054646,
                18
            ]
        ]
    }
]
使用的数据结构- List<String , List<List<Long>>>
我正在绘制下面的图表
脚本代码
<script>

        angular.module('nvd3TestApp', ['nvd3','restangular']).config(function(RestangularProvider){
            RestangularProvider.setBaseUrl('myUrl')}).controller('MainCtrl', function($scope,Restangular) {

      var refreshInterval = 10 * 1000;
      var allCmnts = Restangular.all("getData");

     $scope.fetchData2 = function() {
      allCmnts.getList().then(function(response){
            $scope.data = response;
              });


           $scope.options = {
            chart: {
                type: 'cumulativeLineChart',
                height: 450,
                margin : {
                    top: 20,
                    right: 20,
                    bottom: 60,
                    left: 65
                },
                x: function(d){ return d[0]; },
                y: function(d){ return d[1]; },
                color: d3.scale.category10().range(),
                useInteractiveGuideline: true,


                xAxis: {
                    axisLabel: 'Time In Minutes',
                    tickFormat: function(d) {
                        return d3.time.format('%H:%M')(new Date(d))
                    },
                    showMaxMin: false,

                },

                yAxis: {
                    axisLabel: 'ORDERS',
                    tickFormat: function(d){
                        return d;
                    },

                }
            }
        };
    }

            setInterval(function() {
                $scope.$apply(function() {
                $scope.fetchData2();
                $scope.api.refresh();
                })
            }, refreshInterval);

            $scope.fetchData2();
        });
</script><div ng-app ="nvd3TestApp">
<div ng-controller="MainCtrl">
<nvd3 options="options" data="data"></nvd3>
</div>
</div>我面临的问题
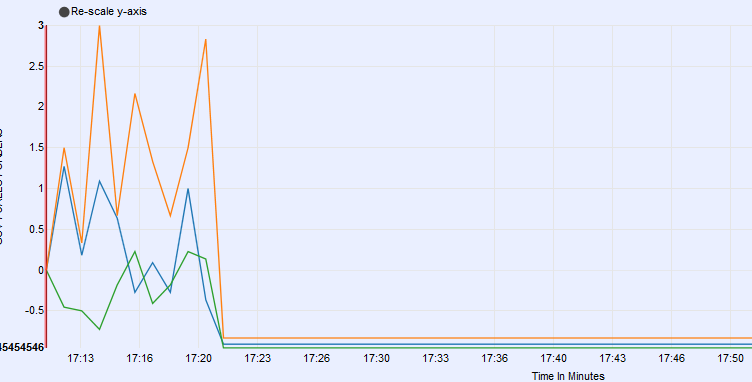
1.)上面的代码运行良好,没有脚本错误,什么也没有。图形正在显示。
2.)Y轴绘制不正确,值以小数形式出现,尽管响应如所示返回Long values.
3.)正在显示y-轴的负图。
4.)X轴不是连续绘制的,意思是17:13 -> 17:16.如何显示17:14,17:15等.
回答 1
Stack Overflow用户
回答已采纳
发布于 2015-12-11 03:49:09
在浏览了多个博客之后,cumulativeLineChart存在一些问题,因此我转而使用lineChart,不需要更改json结构中的任何内容。
下面是我为绘制x轴和y轴所做的更多更改。
negative y-axis绘图的问题已经用linechart解决了。
xAxis: {
                        axisLabel: 'Time In Minutes',
                        tickFormat: function(d) {
                            return d3.time.format('%H:%M')(new Date(d))
                        },
                        orient: 'bottom',
                        tickPadding: 0,
                        rotateLabels: -45,
                        axisLabelDistance: 1,
                        ticks: xlength,
                    },

                    yAxis: {
                        axisLabel: 'data',
                        tickFormat: function(d){
                            return d;
                        },
                        orient: 'left',
                    }
}页面原文内容由Stack Overflow提供。腾讯云小微IT领域专用引擎提供翻译支持
原文链接:
https://stackoverflow.com/questions/33734590
复制相关文章
相似问题
腾讯云开发者

Copyright © 2013 - 2026 Tencent Cloud. All Rights Reserved. 腾讯云 版权所有
深圳市腾讯计算机系统有限公司 ICP备案/许可证号:粤B2-20090059 ![]() 粤公网安备44030502008569号
粤公网安备44030502008569号
腾讯云计算(北京)有限责任公司 京ICP证150476号 | 京ICP备11018762号