
热图中的标签组
热图中的标签组
提问于 2015-03-08 17:03:27
我有一个数组,其中ij第四项是区域i和j共有的基因数目,这些基因在i中相对于j有不同的表达。
标记每一个x号和y号会使图形过于拥挤。类似于this question和this question,我希望对x轴上的标签进行分组。
在Hawrylycz等人(2012年)的以下图像中,热图的xticklabels是我想要的一个很好的例子,xticklabels指的是更一般的区域。例如,额叶下的所有列都与额叶内的大脑结构相对应。
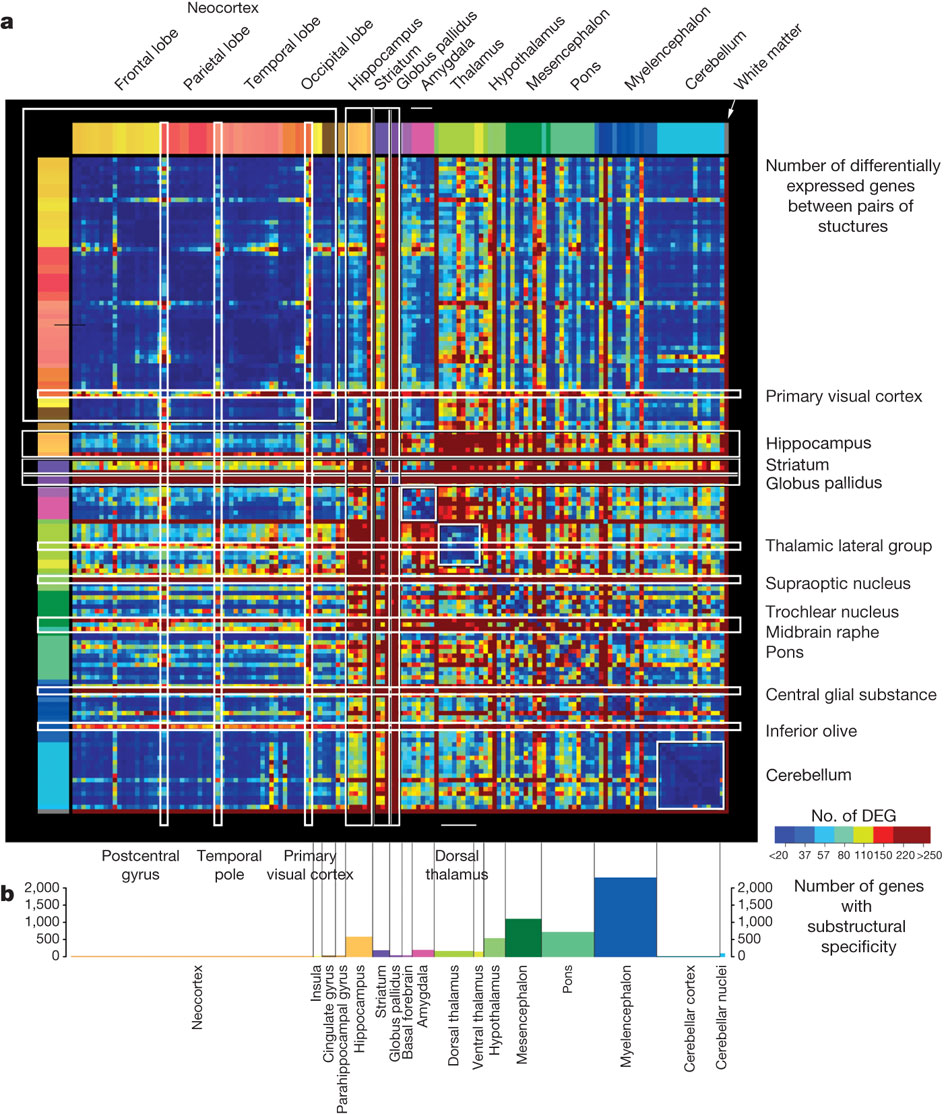
我没有试图复制yticklabels,或条形图内嵌。
My approach
对于热图中的每一个盒子,我都有一个本体。我选择在几个区域绘制结构图,例如只有“额叶和顶叶”。
使用本体,我可以发现每个结构的列组的开始和结束索引。如何使用这些索引来绘制组标签?
回答 1
Stack Overflow用户
回答已采纳
发布于 2015-03-10 04:40:13
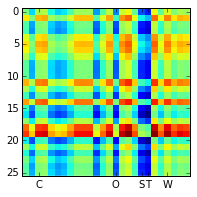
就像这样:
import pandas as pd
from numpy.random import random_integers
from numpy import reshape
import matplotlib.pyplot as plt
from matplotlib.ticker import FixedLocator, FixedFormatter
alph = 'ABCDEFGHIJKLMNOPQRSTUVWXYZ'
lalph = list(alph.lower())
alph = list(alph)

df = pd.DataFrame(random_integers(0,100,(26,26)),columns=alph,
                  index=lalph)

# Two lines just to make a plaid image in imshow
differ = reshape([sum(df[col2]-df[col]) for col2 in df for col in df], (26,26))
differ = pd.DataFrame(differ, columns=alph,index=alph)

# pick the labels you want
ticks = [2, 14, 18, 19, 22] # C=2 because A=0 because Python is 0-indexed
ticklabels = [alph[x] for x in ticks]

fig = plt.figure(figsize=(3,5))
ax = fig.add_subplot(111)
ax.imshow(differ)
ax.autoscale(False)

# display only the chosen ticks and ticklabels
ax.xaxis.set_major_locator(FixedLocator(ticks))
ax.xaxis.set_major_formatter(FixedFormatter(ticklabels))
您将有一个字符串命名基因列表,而不是用作字母列表的字符串,但是imshow轴索引仍然是基础numpy数组的索引。
页面原文内容由Stack Overflow提供。腾讯云小微IT领域专用引擎提供翻译支持
原文链接:
https://stackoverflow.com/questions/28929275
复制相关文章
相似问题
腾讯云开发者

Copyright © 2013 - 2026 Tencent Cloud. All Rights Reserved. 腾讯云 版权所有
深圳市腾讯计算机系统有限公司 ICP备案/许可证号:粤B2-20090059 ![]() 粤公网安备44030502008569号
粤公网安备44030502008569号
腾讯云计算(北京)有限责任公司 京ICP证150476号 | 京ICP备11018762号