
如何在Python中可视化3D delaunay三角剖分?
如何在Python中可视化3D delaunay三角剖分?
提问于 2013-11-17 00:42:30
我有一组三维点,我用scipy.spatial.Delaunay来做三角剖分/四面体化。现在我有了一组四面体的独特面孔,并希望在3D中将它们可视化。
是否有任何Python库(或带有Python包装器的库)能够做到这一点?
回答 3
Stack Overflow用户
回答已采纳
发布于 2013-12-22 08:08:02
试试mayavi.mlab.triangular_mesh()
import numpy as np
from mayavi import mlab
vertices = np.array([[0, 1, 0, 0],[0, 0, 1, 0],[0, 0, 0, 1]])
faces = np.array([[0, 1, 0, 0],[1, 2, 1, 2],[2, 3, 3, 3]])
mlab.triangular_mesh(vertices[0,:], vertices[1,:], vertices[2,:], faces.T)
mlab.show()Stack Overflow用户
发布于 2018-11-13 15:45:13
它也可以使用matplotlib的三维绘图(而不需要mayavi包)。
下面的代码是这样一个函数的初始简单实现。
import numpy as np
import matplotlib.pyplot as plt
from mpl_toolkits import mplot3d
from scipy.spatial import Delaunay

def plot_tri_simple(ax, points, tri):
    for tr in tri.simplices:
        pts = points[tr, :]
        ax.plot3D(pts[[0,1],0], pts[[0,1],1], pts[[0,1],2], color='g', lw='0.1')
        ax.plot3D(pts[[0,2],0], pts[[0,2],1], pts[[0,2],2], color='g', lw='0.1')
        ax.plot3D(pts[[0,3],0], pts[[0,3],1], pts[[0,3],2], color='g', lw='0.1')
        ax.plot3D(pts[[1,2],0], pts[[1,2],1], pts[[1,2],2], color='g', lw='0.1')
        ax.plot3D(pts[[1,3],0], pts[[1,3],1], pts[[1,3],2], color='g', lw='0.1')
        ax.plot3D(pts[[2,3],0], pts[[2,3],1], pts[[2,3],2], color='g', lw='0.1')

    ax.scatter(points[:,0], points[:,1], points[:,2], color='b')
使用下面的测试代码调用此函数的结果如下图所示:
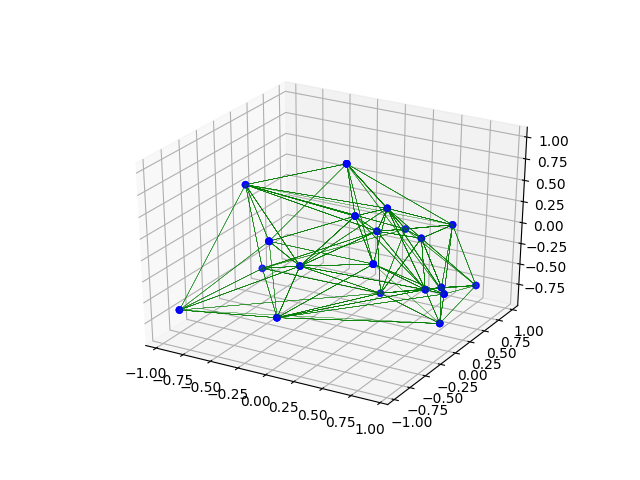
np.random.seed(0)
x = 2.0 * np.random.rand(20) - 1.0
y = 2.0 * np.random.rand(20) - 1.0
z = 2.0 * np.random.rand(20) - 1.0
points = np.vstack([x, y, z]).T
tri = Delaunay(points)

fig = plt.figure()
ax = plt.axes(projection='3d')
plot_tri(ax, points, tri)上面的代码很慢,因为绘图是在循环中完成的。此外,它对每个单形分别工作,因此边被渲染不止一次。下面是一个更有效的实现,它使用辅助函数collect_edges只取一次每个边缘,并使用绘图函数中的np.nan值在一个绘图命令中绘制边缘段。
使用新函数运行上述测试代码的结果给出了相同的图形,但在我的机器上运行时间增加了一倍x80 (300 ms,而不是3.6ms)。
def plot_tri_2(ax, points, tri):
    edges = collect_edges(tri)
    x = np.array([])
    y = np.array([])
    z = np.array([])
    for (i,j) in edges:
        x = np.append(x, [points[i, 0], points[j, 0], np.nan])
        y = np.append(y, [points[i, 1], points[j, 1], np.nan])
        z = np.append(z, [points[i, 2], points[j, 2], np.nan])
    ax.plot3D(x, y, z, color='g', lw='0.1')

    ax.scatter(points[:,0], points[:,1], points[:,2], color='b')


def collect_edges(tri):
    edges = set()

    def sorted_tuple(a,b):
        return (a,b) if a < b else (b,a)
    # Add edges of tetrahedron (sorted so we don't add an edge twice, even if it comes in reverse order).
    for (i0, i1, i2, i3) in tri.simplices:
        edges.add(sorted_tuple(i0,i1))
        edges.add(sorted_tuple(i0,i2))
        edges.add(sorted_tuple(i0,i3))
        edges.add(sorted_tuple(i1,i2))
        edges.add(sorted_tuple(i1,i3))
        edges.add(sorted_tuple(i2,i3))
return edgesStack Overflow用户
发布于 2019-04-18 07:59:16
搅拌机BPY可以做到这一点,BGE python也能做到这一点。
blender.org
页面原文内容由Stack Overflow提供。腾讯云小微IT领域专用引擎提供翻译支持
原文链接:
https://stackoverflow.com/questions/20025784
复制相关文章
相似问题
腾讯云开发者

Copyright © 2013 - 2026 Tencent Cloud. All Rights Reserved. 腾讯云 版权所有
深圳市腾讯计算机系统有限公司 ICP备案/许可证号:粤B2-20090059 ![]() 粤公网安备44030502008569号
粤公网安备44030502008569号
腾讯云计算(北京)有限责任公司 京ICP证150476号 | 京ICP备11018762号