
用日期变量创建世界地图
我试图用一个数据表创建两个版本的世界地图。数据表的列是: Country Name iso3 FormDate FormDate变量是日期--在本例中,是国家正式成立的日期。(如图所示- formation)
formdate <- read.table(text="
ISO3\tCountry\tFormation Date
DZA\tAlgeria\t07-03-1962
AGO\tAngola\t11-11-1975
BWA\tBotswana\t09-30-1966
CMR\tCameroon\t01-01-1960
BGD\tBangladesh\t03-26-1971
IND\tIndia\t08-15-1947
ISR\tIsrael\t05-14-1948
LOS\tLaos\t10-22-1953
MYS\tMalaysia\t09-16-1963
SGP\tSingapore\t08-09-1965"
,sep="\t",header=TRUE)

> formdate
   ISO3    Country Formation.Date
1   DZA    Algeria     07-03-1962
2   AGO     Angola     11-11-1975
3   BWA   Botswana     09-30-1966
4   CMR   Cameroon     01-01-1960
5   BGD Bangladesh     03-26-1971
6   IND      India     08-15-1947
7   ISR     Israel     05-14-1948
8   LOS       Laos     10-22-1953
9   MYS   Malaysia     09-16-1963
10  SGP  Singapore     08-09-1965
我想制作的地图如下:
1:一个摘要地图,每个国家的颜色编码,其形成年份,自动双联为5-7类。
2:一张3倍面的地图,有独立的国家在1945年出生,1945年以后到1965年,以及之后的任何时候。麻烦的是,我希望能够改变这些截止年份。
这个问题与Using [R] maps package - colouring in specific nations on a world map、RScript to create World Map with own values和How to create a world map in R with specific countries filled in?有关,就像我试图创建一个具有自己价值的地图一样。
这里的区别是,我需要使用日期变量,特别是,绘制这些日期的二进制值。
非常感谢您的帮助和建议。
回答 2
Stack Overflow用户
发布于 2013-10-21 14:39:47
这里有一个使用rworldmap的解决方案。
图书馆(Rworldmap)
#Your data
formdate <- read.table(text="
ISO3\tCountry\tFormation Date
DZA\tAlgeria\t07-03-1962
AGO\tAngola\t11-11-1975
BWA\tBotswana\t09-30-1966
CMR\tCameroon\t01-01-1960
BGD\tBangladesh\t03-26-1971
IND\tIndia\t08-15-1947
ISR\tIsrael\t05-14-1948
LOS\tLaos\t10-22-1953
MYS\tMalaysia\t09-16-1963
SGP\tSingapore\t08-09-1965"
,sep="\t",header=TRUE)

#just using year as a first step
formdate$Formation.Year<-year(formdate$Formation.Date)

#sPDF <- joinCountryData2Map( formdate, joinCode="ISO3", nameJoinColumn="ISO3")
#joining by country name works better because of incorrect ISO3 code for Laos in the data
sPDF <- joinCountryData2Map( formdate, joinCode="NAME", nameJoinColumn="Country")

#Using defaults, change catMethod, numCats & colourPalette to change map appearance
mapCountryData(sPDF, nameColumnToPlot="Formation.Year")
..。在第二阶段,为不同年份制作3块贴图的面板:
#I've used these breaks that work with your sample data,
#simply cahnge to work with full dataset
yearBreak1 <- 1960
yearBreak2 <- 1970

oldPar <- par(mar=c(0.7, 0, 0, 0)) #set margins for subplots top,bottom,left,right
#use layout to set up 3 panels
nPanels <- layout( cbind(c(0,1:3))
                   , heights=c(lcm(0.5),c(1,1,1))
                   , respect=F )

#add a constant column to allow plotting all countries the same colour
formdate$constant <- 1

#subet data by yearBreaks
dF1 <- formdate[ formdate$Formation.Year <= yearBreak1, ]
dF2 <- formdate[ formdate$Formation.Year > yearBreak1 & formdate$Formation.Year <= yearBreak2, ]
dF3 <- formdate[ formdate$Formation.Year > yearBreak2, ]

#join to a map
sPDF1 <- joinCountryData2Map( dF1, joinCode="NAME", nameJoinColumn="Country")
sPDF2 <- joinCountryData2Map( dF2, joinCode="NAME", nameJoinColumn="Country")
sPDF3 <- joinCountryData2Map( dF3, joinCode="NAME", nameJoinColumn="Country")

#plot & add titles
mapCountryData(sPDF1, nameColumnToPlot="constant", catMethod='categorical', addLegend=FALSE, mapTitle="" )
mtext(paste("<=",yearBreak1))
mapCountryData(sPDF2, nameColumnToPlot="constant", catMethod='categorical', addLegend=FALSE, mapTitle="" )
mtext(paste(">",yearBreak1,"& <=",yearBreak1))
mapCountryData(sPDF3, nameColumnToPlot="constant", catMethod='categorical', addLegend=FALSE, mapTitle="" )
mtext(paste(">",yearBreak2))
应该产生这样的结果:
Stack Overflow用户
发布于 2013-10-21 08:16:13
也许这并不是最直截了当的做法,但以下是您的第一点的解决方案:
# First changing the class of the two columns we're going to use:
formdate$Formation.Date<-as.Date(formdate$Formation.Date, "%m-%d-%Y")
formdate$ISO3<-as.character(formdate$ISO3)
formdate$ISO3[8]<-"LAO" #Laos'ISO3 code is "LAO" and not "LOS" in the wrld_simpl data
# Make regular temporal interval
intval <- cut(formdate$Formation.Date,
              breaks = seq(min(formdate$Formation.Date),max(formdate$Formation.Date),length=5),
              right=TRUE, include.lowest=TRUE) # So that the intervals include the lowest date and the highest
# Make these values correspond with their polygons
library(maptools)
data(wrld_simpl)
f <- rep(NA,nrow(wrld_simpl@data))
f[sapply(formdate$ISO3,function(x)which(wrld_simpl$ISO3==x))] <- intval
# Plot
plot(wrld_simpl, col=(1:6)[f])
关于你的第二点:
#This time you can define your breakpoints before hand (don't forget to include a minimum age and a maximum age)
d <- c("1900/01/01","1945/01/01","1965/01/01","2020/01/01")
intval <- cut(formdate$Formation.Date,
                  breaks = as.Date(d))
f <- rep(0,nrow(wrld_simpl@data))
f[sapply(formdate$ISO3,function(x)which(wrld_simpl$ISO3==x))] <- intval
然后密谋:
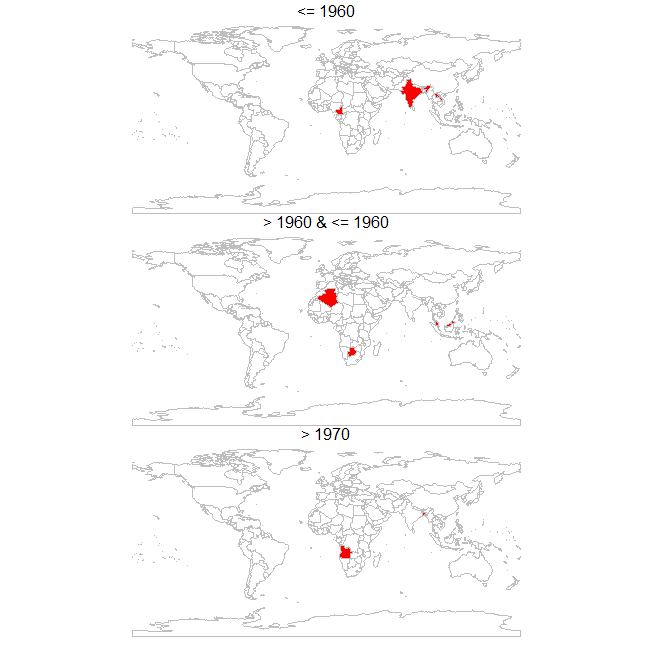
par(mfcol=c(3,1)) #Here, three vertical panels
for(i in 1:3){
   par(mar=c(0,0,0,0))
   plot(wrld_simpl) #First plot the whole world
   if(any(f==i)){
       plot(wrld_simpl[f==i,],add=TRUE,col="red") #Then the countries that belong to the proper category
       }
}https://stackoverflow.com/questions/19487868
复制相似问题
腾讯云开发者

Copyright © 2013 - 2026 Tencent Cloud. All Rights Reserved. 腾讯云 版权所有
深圳市腾讯计算机系统有限公司 ICP备案/许可证号:粤B2-20090059 ![]() 粤公网安备44030502008569号
粤公网安备44030502008569号
腾讯云计算(北京)有限责任公司 京ICP证150476号 | 京ICP备11018762号