
Chart.js x-轴与日期DD-MM-YYYY -反应
Chart.js x-轴与日期DD-MM-YYYY -反应
提问于 2019-11-08 12:04:27
我正在尝试使用库Chart.js显示一个图形。
我的数据格式如下:
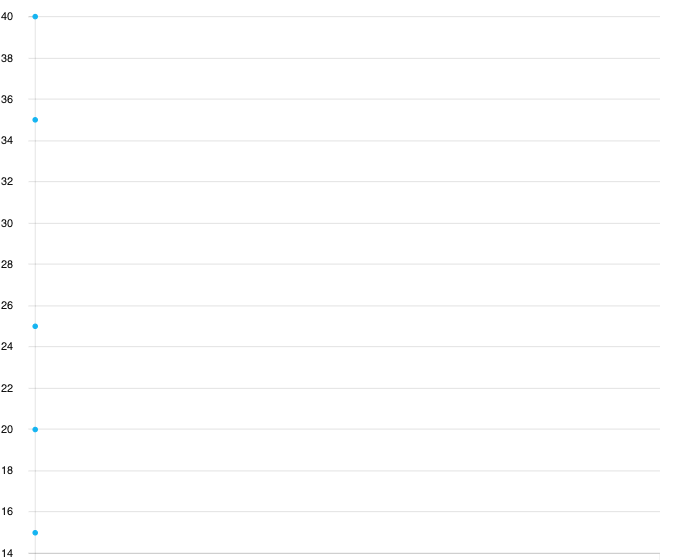
data: [["15-11-2019", 25], ["16-11-2019", 35], ["17-11-2019", 40], ["18-11-2019", 20], ["19-11-2019", 15]]我无法在时间轴中转换x轴.
我试图传入options参数time类型,但它似乎不起作用。图呈现,但x轴不存在,只有y轴存在.
import React, {Component,  useState, useEffect, useCallback} from 'react';
import Plot from 'react-plotly.js';
import { Chart } from 'react-charts'

function MyChart() {
    const data = React.useMemo(
        () => [
            {
                label: 'Series 1',
                data: [["15-11-2019", 25], ["16-11-2019", 35], ["17-11-2019",40], ["18-11-2019", 20], ["19-11-2019", 15]]
            }],
        []
    )

    const axes = React.useMemo(
        () => [
            { primary: true, type: 'linear', position: 'bottom' },
            { type: 'linear', position: 'left' },
        ],
        []
    )

    const options = React.useMemo(
        () => [
            {
        scales: {
            xAxes: [{
                type: 'time',
                time: {
                    unit: 'day'
                }
            }]
        }
    }
        ],
        []
    )

    return (
        // A react-chart hyper-responsively and continuusly fills the available
        // space of its parent element automatically
        <div
            style={{
                width: '600px',
                height: '500px'
            }}
        >
            <Chart data={data} axes={axes} options={options}/>
        </div>
    )
}

export default MyChart;
回答 1
Stack Overflow用户
发布于 2019-11-08 12:38:22
更新:请参阅文档中有关格式的特定行
在使用时间尺度时,可以通过t或x属性额外指定x轴数据点。在这里可以看到更多https://www.chartjs.org/docs/latest/axes/cartesian/time.html
数据字段必须是x,y值的字典/对象:
data: [{x: "2019-01-03", y: 15}, {x: "2019-01-04", y: 18}, ...]创建图表时,请在type中设置options.scales
...,
options: {
 scales: {
  xAxes: [{
   type: 'time',
  }]
},
...页面原文内容由Stack Overflow提供。腾讯云小微IT领域专用引擎提供翻译支持
原文链接:
https://stackoverflow.com/questions/58766256
复制相关文章
相似问题
腾讯云开发者

Copyright © 2013 - 2026 Tencent Cloud. All Rights Reserved. 腾讯云 版权所有
深圳市腾讯计算机系统有限公司 ICP备案/许可证号:粤B2-20090059 ![]() 粤公网安备44030502008569号
粤公网安备44030502008569号
腾讯云计算(北京)有限责任公司 京ICP证150476号 | 京ICP备11018762号