
用ggmap和Stamen图在R中的映射:标记点和标度
我正在尝试用ggmap和Stamen地图来制作我的学习站点的地图。我见过一些类似的问题,但还没有想出将解决方案合并到我的Stamen代码中的方法。
关于这一点,我有两个问题: 1.如何自定义地图上的点? 2.如何在星光地图中增加地图的比例?(在现实生活中,用线表示距离或地图上的x厘米=y公里)
Tcoords <- read.csv("Tcoords.csv")我的档案看上去像这样
# trap latitude longitude
1 52.34431 0.5374620
2 52.34281 0.5382080
3 52.34468 0.5406787
4 52.34357 0.5398280
5 52.34431 0.5397050
6 52.34516 0.5406294作为对建议的回应,我将结果粘贴到dput(head(Tcoords))中:
 structure(list(trap = c("1", "2", "3", "4", "5", "6"), latitude = c(52.344312,
52.342809, 52.3446849, 52.343572, 52.34431, 52.3451601), longitude = c(0.537462,
0.538208, 0.5406787, 0.539828, 0.539705, 0.5406294)), row.names = c(NA,
6L), class = "data.frame")
这是我用来绘制我的观点的代码
center = c(lon = 0.5406294, lat = 52.3451601)
qmap(center, zoom = 16, source = "stamen", maptype = "watercolor")+
      geom_point(aes(x = longitude, y = latitude), size = 4, shape = 21,
                 fill = "dark green", data = Tcoords)
但不知何故,陷阱并没有被认为是一个物体。这可能是一些基本的东西,但我不太确定我错过了什么(新的R)。我把“陷阱”作为文本对象保存在这里。
谢谢你的帮忙!
回答 2
Stack Overflow用户
发布于 2020-10-22 19:59:58
我想建议tmap作为ggmap的替代方案。这是创建地图的许多其他包之一,CRAN任务视图:空间,但我发现tmap生成的缩放条相当不错,代码也很简单。
生成最终绘图的代码需要以下软件包
# To create the map
library(tmap)
# To create the layer with the points given in Tcoords.csv
library(sf)
# To read the background map
library(tmaptools)
library(OpenStreetMap)
然后,我们读取要映射的六个点的坐标,并将它们转换为sf对象。
# Read coordinates
Tcoords = dget("Tcoords.R")

# create an sf object for the six points in the file
coordinates = matrix(c(Tcoords$longitude, Tcoords$latitude), 6, 2)
tcoords_sfc = lapply(1:6, function(k) st_point(coordinates[k, ])) %>%
  st_sfc(crs = 4326)
tcoords_sf = st_sf(trap = Tcoords$trap, geometry = tcoords_sfc)
接下来,我们找出六点(包围盒)的极限,并将其扩展到因子2.5。你可以玩这个因素,以获得地图与其他比例。
bb_new = bb(tcoords_sf, ext = 2.5)最后,我们看了背景图。
map_osm = read_osm(bb_new, zoom = 15, type = "stamen-watercolor")然后画出最后的地图
使用以下代码
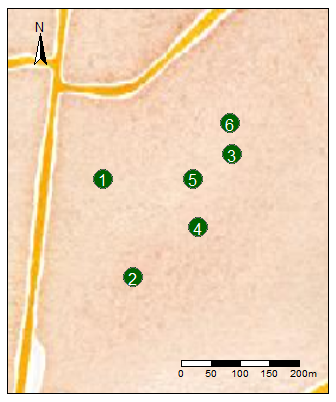
tmap_mode("plot")
tm_shape(map_osm, projection = 4326, unit = "m") +
  tm_rgb() +
  tm_shape(tcoords_sf) +
  tm_symbols(col = "darkgreen", shape = 21, size = 2) +
  tm_text(text = "trap", col = "white") +
  tm_scale_bar(breaks = c(0, 50, 100, 150, 200), text.size = 0.6) +
  tm_compass(position = c("left", "top"))
要获得动态映射甚至更简单,因为您没有先读取basemap (read_osm),然后绘制映射。
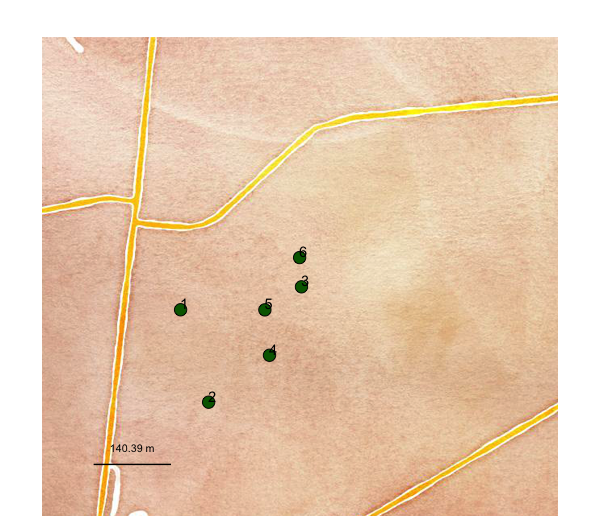
tmap_mode("view")
tm_shape(tcoords_sf, bbox = bb_new, unit = "m") +
  tm_symbols(col = "darkgreen", shape = 21, size = 3) +
  tm_text(text = "trap", col = "white") +
  tm_basemap("Stamen.Watercolor") +
tm_scale_bar()在静态情节中,色彩、文字和断点在比例上都可以个性化。注意参数unit = "m"在tm_shape中,以便得到以米为单位的比例尺,如果不是,它将以公里为单位。
希望你会发现这一选择值得一提。
Stack Overflow用户
发布于 2020-05-30 03:16:50
将标签放到地图上只是重新定义geom_text()函数中的数据源的问题。
为了在地图上打印出比例尺,这是一个问题的解决方案:有没有办法在ggmap中添加一个缩放条(用于线性距离)?
#get base map
map.base <- get_map(location = center, zoom = 16, source = "stamen", maptype = "watercolor") # could also use zoom = "auto"
#get extent of base map
bb <- attr(map.base,"bb")

#define the location and length of scale bar
sbar <- data.frame(lon.start = c(bb$ll.lon + 0.1*(bb$ur.lon - bb$ll.lon)),
                   lon.end = c(bb$ll.lon + 0.25*(bb$ur.lon - bb$ll.lon)),
                   lat.start = c(bb$ll.lat + 0.1*(bb$ur.lat - bb$ll.lat)),
                   lat.end = c(bb$ll.lat + 0.1*(bb$ur.lat - bb$ll.lat)))

#Calculate distance in meters
library(geosphere)
sbar$distance = distGeo(c(sbar$lon.start,sbar$lat.start), c(sbar$lon.end,sbar$lat.end))

map.scale <- ggmap(map.base, extent="device")   +
   geom_point(aes(x = longitude, y = latitude), size = 4, shape = 21, fill = "dark green", data = Tcoords) +
   geom_text(data=Tcoords, aes(label=trap, x = longitude, y = latitude), nudge_x = 0.0001, nudge_y = 0.0001, color="black") +

   geom_segment(data = sbar,  aes(x = lon.start, xend = lon.end, y = lat.start, yend = lat.end)) +
   geom_text(data = sbar,  aes(x = (lon.start + lon.end)/2,
                 y = lat.start + 0.025*(bb$ur.lat - bb$ll.lat),
                 label = paste(format(distance,   digits = 4, nsmall = 2), 'm')),
             hjust = 0.5, vjust = 0)
map.scale
可能需要调整nudge_x & _y在geom_text()函数中的正确位置。
https://stackoverflow.com/questions/62091163
复制相似问题
腾讯云开发者

Copyright © 2013 - 2026 Tencent Cloud. All Rights Reserved. 腾讯云 版权所有
深圳市腾讯计算机系统有限公司 ICP备案/许可证号:粤B2-20090059 ![]() 粤公网安备44030502008569号
粤公网安备44030502008569号
腾讯云计算(北京)有限责任公司 京ICP证150476号 | 京ICP备11018762号