
在python中使用for循环从多个excel工作表创建子图
我试图使用for循环创建子图,其中的数据是基于多个excelsheets的。您可以看到下面的脚本。
#import libraries
import pandas as pd
import matplotlib.pyplot as plt
import numpy as np
#import the excel file
path ='F:\Backup\JN\TOR\TOR well py.xlsx'
data= pd.ExcelFile(path)
#some intro before getting into the for in loop
sheets = data.sheet_names
well = ''
totalsheets = len(sheets)
print(sheets)
print(totalsheets)
for n in range(totalsheets):
fig, axs=plt.subplots(1, totalsheets, figsize=(20,25))
for i in sheets:
well=pd.read_excel(data, sheet_name=i)
axs[n].set_xlabel('Temperature ($^o$C), Pressure (bar)')
axs[n].set_ylabel('Elevation (masl)')
axs[n].set_title(('Well-'+str(i)+ '\n' )+ (str(well['ket'][0])))
axs[n].plot(well['T'], well['mdpl pt'], marker='o', color='blue', label='Temperature')
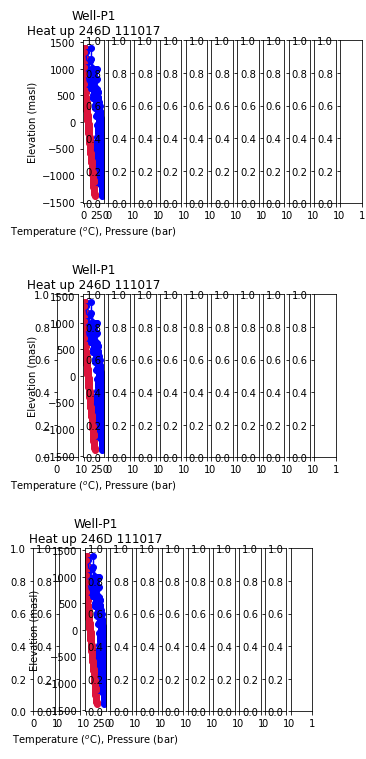
axs[n].plot(well['P'], well['mdpl pt'], marker='o', color='crimson', label='Pressure')相反,脚本得到一个包含1行和11列的子图图,其中每个子图表示每个数据表,脚本生成了11个子图图(1行,11列)。在子图上描述的数据仅来自最后一张纸“P1”,它是从第一列依次绘制到每个子图中的,然后是第二列、第三列、第四列等等(参见下面的图,我只显示了11个数字中的3个)。
在看到结果之后,我想我对for循环脚本做了一些错误。请帮忙,非常感谢。
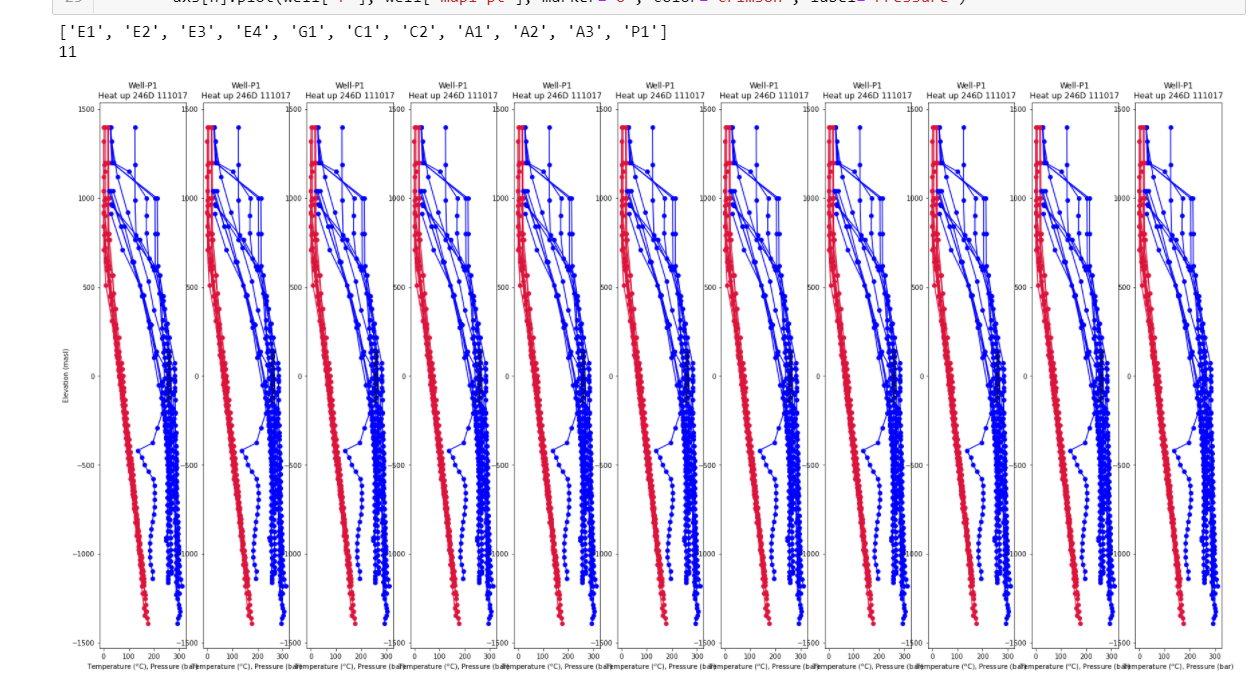
'E1','E2','E3','E4','G1','C1','C2','A1','A2','A3','P1‘
11
当我将无花果移到for循环之外后,我成功地创建了一个包含11个子图的图形。但所有11个子图只显示来自一个表格(只有P1)的数据,而不是从excel中的11个表格中显示数据,以填充每个子图“E1”、“E2”、“E3”、“E4”、“G1”、“C1”、“C2”、“A1”、“A2”、“A3”、“P1”。我是不是错过了for循环脚本中的什么东西?(见下面的截图)
回答 1
Stack Overflow用户
发布于 2020-09-15 14:41:10
请检查一下片段。
您已经在for循环中创建了fig, axs=plt.subplots(1, totalsheets, figsize=(20,25))。在这里,您的totalsheets=11,因此,您收到11个情节,在11行。
只要将您的fig放在for循环之外,您的问题就会得到解决。
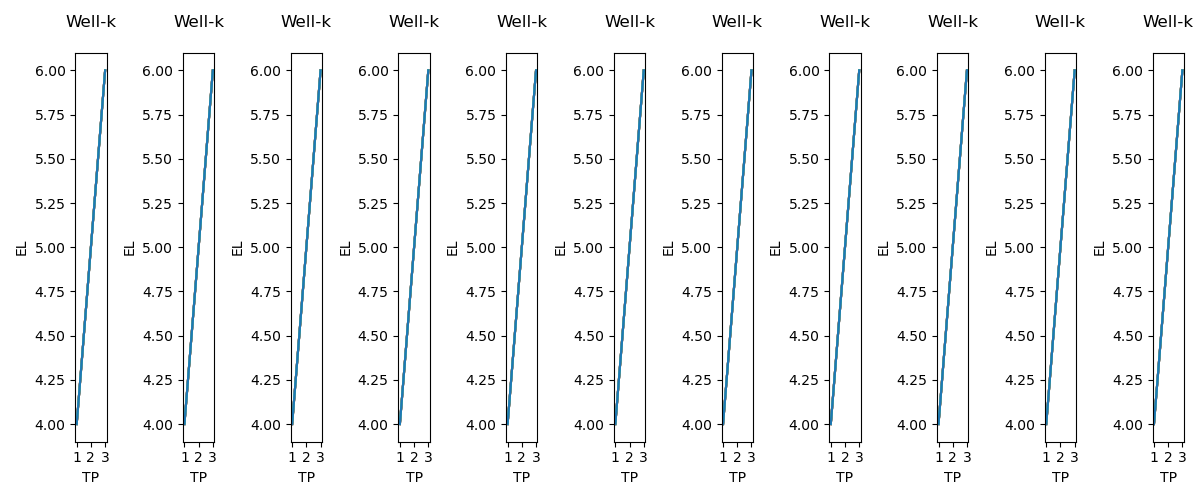
import numpy as np
import matplotlib.pyplot as plt

totalsheets=11
fig, axs = plt.subplots(nrows=1, ncols=totalsheets, figsize=(12,5))
x = [1, 2, 3]
y = [4, 5, 6]
sheets=["a","b","c","d","e","f","g","h","i","j","k"]
for n in range(totalsheets):
    for i in sheets:
        axs[n].plot(x, y)
        axs[n].set_xlabel('TP')
        axs[n].set_ylabel('EL')
        axs[n].set_title('Well-'+str(i)+ '\n' )
fig.tight_layout()
plt.show()
编辑:基于您的注释,这将从单独的工作表中获取数据,很可能数据列名应该相同
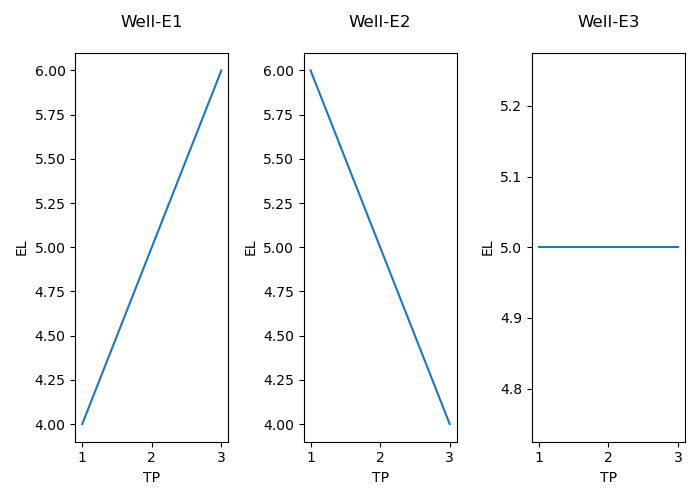
import numpy as np
import matplotlib.pyplot as plt
import pandas as pd
data= pd.ExcelFile('datas.xlsx')
sheets=data.sheet_names
fig, axs = plt.subplots(nrows=1, ncols=len(sheets), figsize=(7,5))
for n in range(len(sheets)):
    well=pd.read_excel('datas.xlsx', sheet_name=n)
    axs[n].plot(well['a'], well['b'])
    axs[n].set_xlabel('TP')
    axs[n].set_ylabel('EL')
    axs[n].set_title('Well-'+str(sheets[n])+ '\n' )
fig.tight_layout()
plt.show()https://stackoverflow.com/questions/63903490
复制相似问题
腾讯云开发者

Copyright © 2013 - 2026 Tencent Cloud. All Rights Reserved. 腾讯云 版权所有
深圳市腾讯计算机系统有限公司 ICP备案/许可证号:粤B2-20090059 ![]() 粤公网安备44030502008569号
粤公网安备44030502008569号
腾讯云计算(北京)有限责任公司 京ICP证150476号 | 京ICP备11018762号