
ggplot2 box_plot添加观察数
ggplot2 box_plot添加观察数
提问于 2020-12-07 22:54:38
我有这个问题,应该是微不足道的,但到目前为止,我看到的例子都没有帮助。我在R中有这个融化的数据,我想用box_plot做一个geom_points。到目前为止,代码是有效的。
 head(df3)
  microRNAs        variable     value
1 geneA      LC1_average_TPM   520075.23
2 geneB      LC1_average_TPM   315802.96
3 geneC      LC1_average_TPM   13356.56
4 geneD      LC1_average_TPM   13348.82
5 geneE      LC1_average_TPM   13331.13
6 geneF      LC1_average_TPM   13309.27

ggplot(df3, aes(x=variable, y=log(value), fill=variable)) +
    geom_boxplot(aes(fill = variable))+
    geom_point(shape = 21, alpha = 0.9, position=position_jitterdodge(jitter.width = 3, jitter.height = 0)) +
    scale_fill_brewer(palette = "Spectral") +   scale_y_continuous(limits=c(0,15), breaks=seq(0,15,1)) + theme(axis.text.x=element_blank()) + ylab("log2(Expression TPM)") +  xlab ("Libraries")
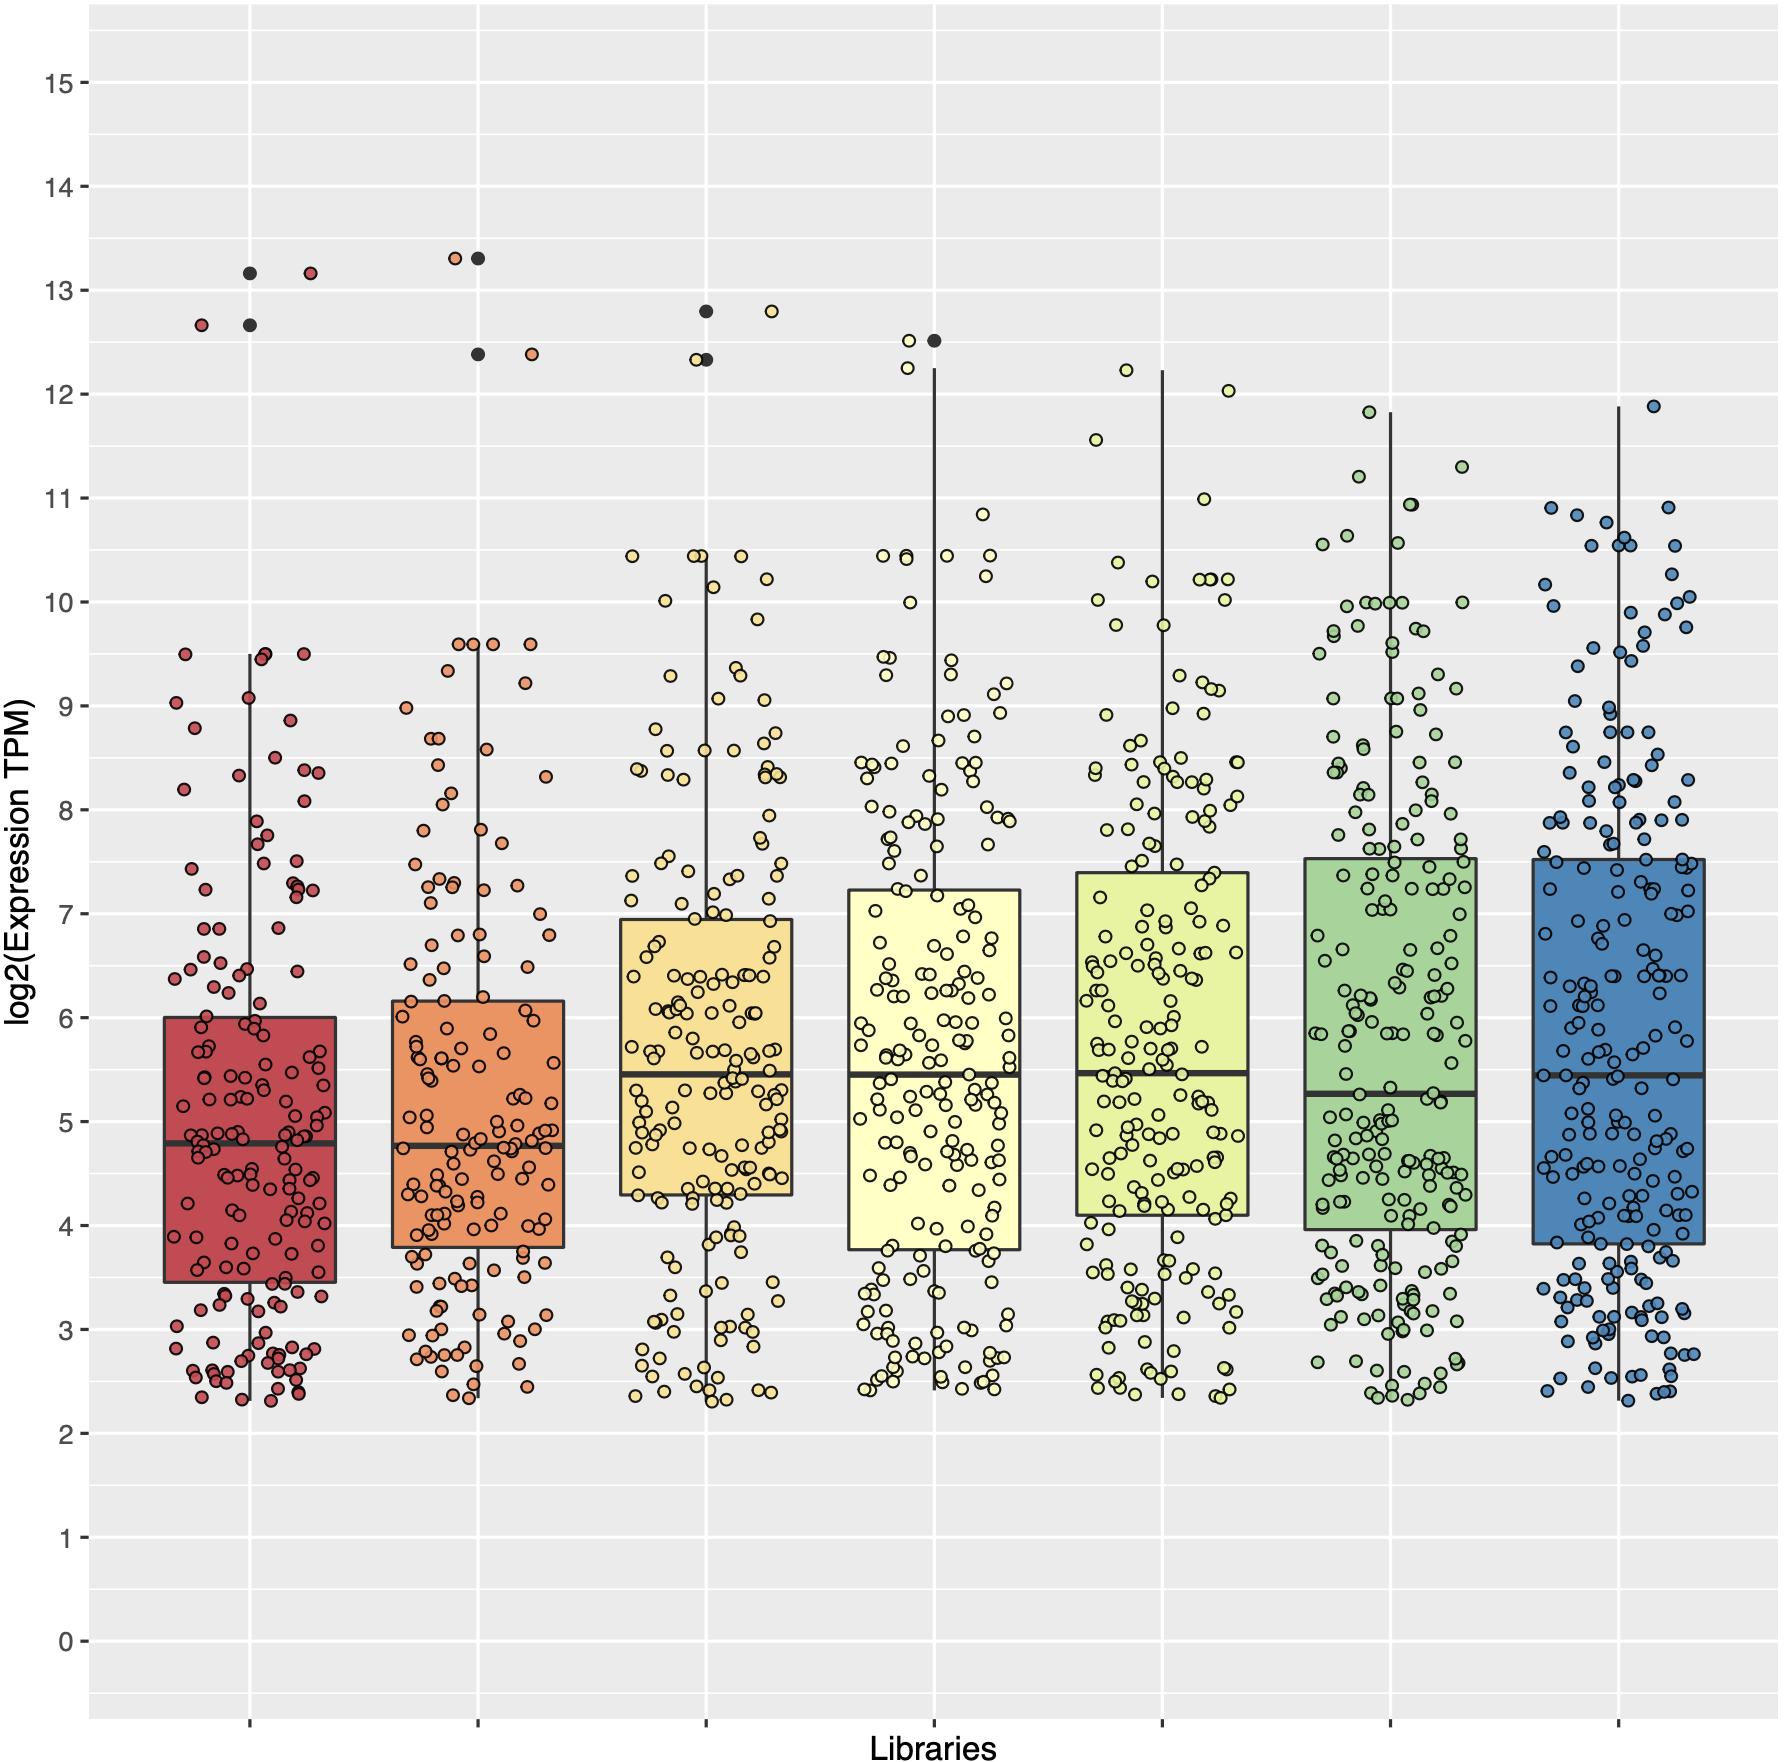
我的问题是,我想在这个情节中增加一些观察。观测结果由每个DF3$变量得到的数据点数决定。
回答 1
Stack Overflow用户
回答已采纳
发布于 2020-12-08 00:04:32
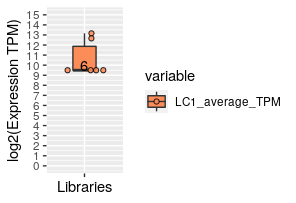
如果您使用mutate,正如我的注释所建议的那样,它是可行的,但是您将得到多个重复的n值,您需要使用summarsie并创建一个单独的表。您将使用geom_text()参数将其添加到data调用中。我将您的data.frame命名为"df“,但在您的情况下为df3进行了调整。
counts_df <-
df %>%
  group_by(variable) %>%
  summarise(group_n = length(variable))

df %>%
  ggplot(aes(x=variable, y=log(value), fill=variable)) +
  geom_boxplot(aes(fill = variable))+
# this is what you want to add < ----
  geom_text(
    data = counts_df,
    aes(variable, y=10,
                label=group_n))+
  geom_point(shape = 21, alpha = 0.9, position=position_jitterdodge(jitter.width = 3, jitter.height = 0)) +
  scale_fill_brewer(palette = "Spectral") +
  scale_y_continuous(limits=c(0,15), breaks=seq(0,15,1)) +
  theme(axis.text.x=element_blank()) +
  ylab("log2(Expression TPM)") +
xlab ("Libraries")它产生这个可怕的情节,调整美学和n的位置使用y参数。
页面原文内容由Stack Overflow提供。腾讯云小微IT领域专用引擎提供翻译支持
原文链接:
https://stackoverflow.com/questions/65190630
复制相关文章
相似问题
腾讯云开发者

Copyright © 2013 - 2026 Tencent Cloud. All Rights Reserved. 腾讯云 版权所有
深圳市腾讯计算机系统有限公司 ICP备案/许可证号:粤B2-20090059 ![]() 粤公网安备44030502008569号
粤公网安备44030502008569号
腾讯云计算(北京)有限责任公司 京ICP证150476号 | 京ICP备11018762号