
用OpenCV识别7段显示的号码
用OpenCV识别7段显示的号码
提问于 2021-01-19 01:10:51
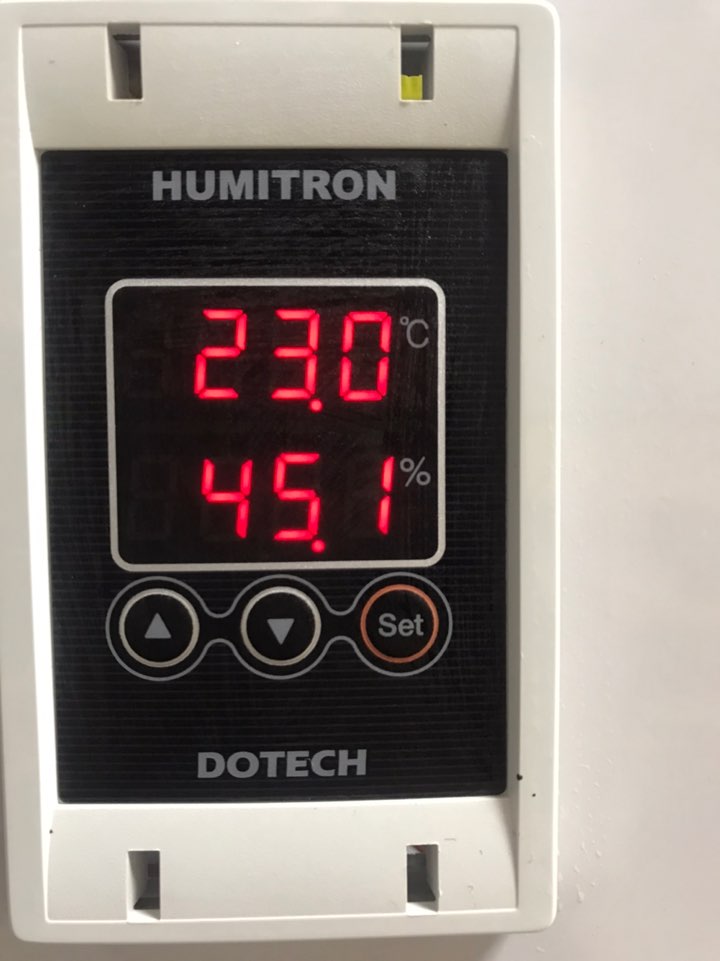
我正在尝试识别7段显示上的数字。
我用巨蟒在木星笔记本上。
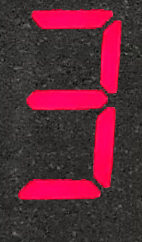
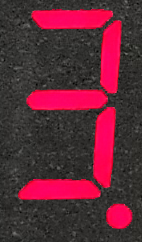
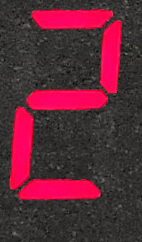
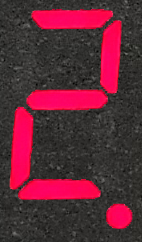
我有0~9 7段显示的数字图像,以及每一个数字。是分开保存的。下面是3,3.,2,2.的样本图像
我想在目标图像上找到这些图像。
我听说有一些工具可以在OpenCV上找到类似的图像。
我尝试了布鲁特力匹配与SIFT描述符和比率测试,但输出似乎不准确。
import numpy as np
import cv2 as cv
import matplotlib.pyplot as plt

img1 = cv2.imread('C:\\Users\\USER\\Desktop\\test\\deeplearningimage\\thermo\\3..png',cv2.IMREAD_GRAYSCALE) # trainImage
img2 = cv2.imread('C:\\Users\\USER\\Desktop\\test\\thermosample.jpg',cv2.IMREAD_GRAYSCALE)          # queryImage
# Initiate SIFT detector
sift = cv.SIFT_create()
# find the keypoints and descriptors with SIFT
kp1, des1 = sift.detectAndCompute(img1,None)
kp2, des2 = sift.detectAndCompute(img2,None)
# BFMatcher with default params
bf = cv2.BFMatcher()
matches = bf.knnMatch(des1,des2,k=2)
# Apply ratio test
good = []
for m,n in matches:
    if m.distance < 0.75*n.distance:
        good.append([m])
# cv.drawMatchesKnn expects list of lists as matches.
img3 = cv2.drawMatchesKnn(img1,kp1,img2,kp2,good,None,flags=cv.DrawMatchesFlags_NOT_DRAW_SINGLE_POINTS)
plt.imshow(img3),plt.show()'
下面是上面代码的输出
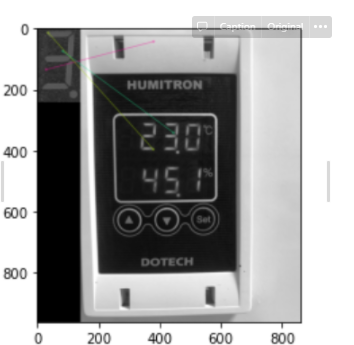
不知道该怎么做。还有其他opencv可以解决这个问题吗?
回答 1
Stack Overflow用户
发布于 2021-01-22 06:29:46
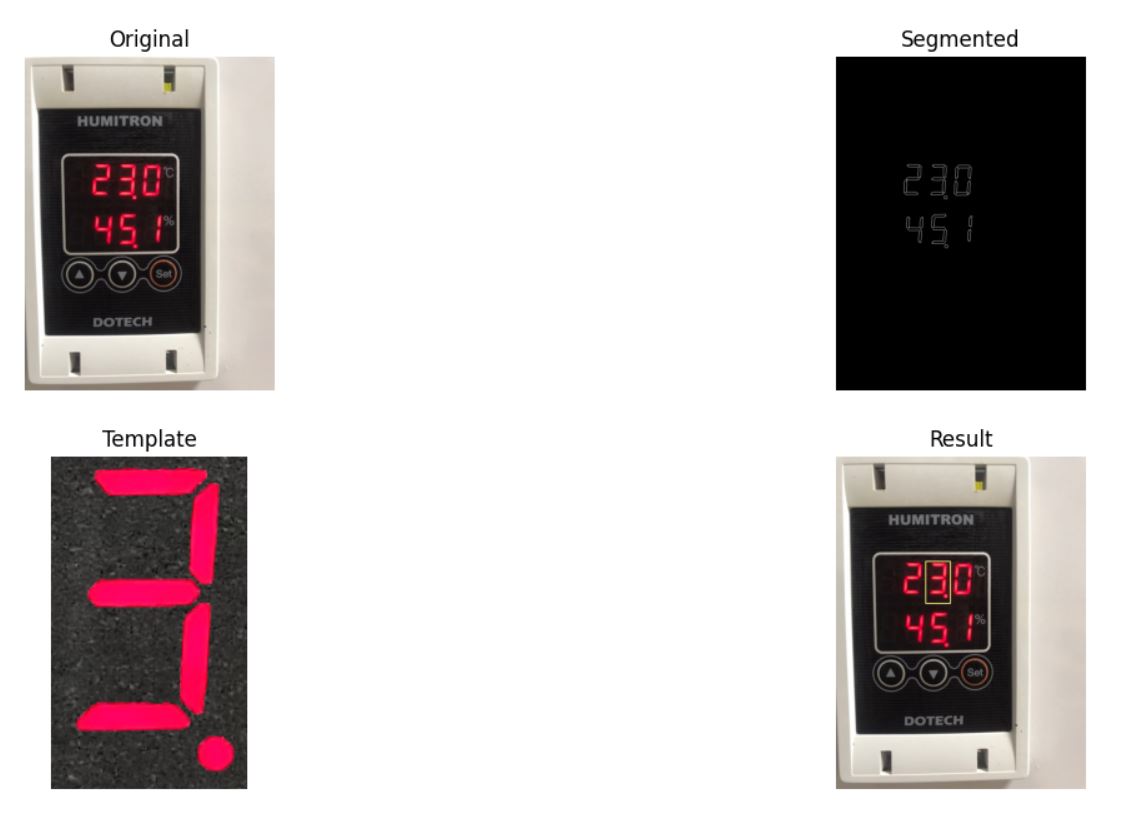
您可以在阈值后使用模板匹配和边缘检测。
import numpy as np
import matplotlib.pyplot as plt
import cv2

# Read Image
BGR = cv2.imread('input.jpg')
RGB = cv2.cvtColor(BGR, cv2.COLOR_BGR2RGB)

# Channels split
R = BGR[...,2]
G = BGR[...,1]
B = BGR[...,0]

# Threshold per channel
R[B>120] = 0
R[G>120] = 0
R[R<230] = 0

# Binarize
Binary = cv2.threshold(R, 127, 255, cv2.THRESH_BINARY)[1]
# Edge Detection
Edges = cv2.Canny(Binary, 50, 200)

# Read Template
templBGR = cv2.imread('templ.png')
templRGB =  cv2.cvtColor(templBGR, cv2.COLOR_BGR2RGB)
templateGray =  cv2.cvtColor(templBGR, cv2.COLOR_BGR2GRAY)
# Binarize Template
templateBinary = cv2.threshold(templateGray, 84, 255, cv2.THRESH_BINARY)[1]
# Denoise Template
templateFiltered = cv2.medianBlur(templateBinary,7)
# Resize Template
template = cv2.resize(templateFiltered, (templBGR.shape[1]//2, templBGR.shape[0]//2))
# Edge Detection Template
templateEdges = cv2.Canny(template, 50, 200)
# Extract Dimensions
h, w = template.shape

res = cv2.matchTemplate(Edges,templateEdges,cv2.TM_CCORR)

(_, _, _, maxLoc) = cv2.minMaxLoc(res)

img = RGB.copy()
cv2.rectangle(img, (maxLoc[0], maxLoc[1]), (maxLoc[0] + w, maxLoc[1] + h), (255,255,128), 2)

plt.subplot(221)
plt.imshow(RGB)
plt.title('Original')
plt.axis('off')

plt.subplot(222)
plt.imshow(Edges, cmap='gray')
plt.title('Segmented')
plt.axis('off')

plt.subplot(223)
plt.imshow(templRGB)
plt.title('Template')
plt.axis('off')

plt.subplot(224)
plt.imshow(img)
plt.title('Result')
plt.axis('off')

plt.show()如果您想要更好地使用multi-matching,可以使用循环
threshold = 0.8
Loc = np.where( res >= threshold)
for pt in zip(*Loc):
cv2.rectangle(img, (Loc[0], Loc[1]), (Loc[0] + w, Loc[1] + h), (255,255,128), 2)页面原文内容由Stack Overflow提供。腾讯云小微IT领域专用引擎提供翻译支持
原文链接:
https://stackoverflow.com/questions/65784205
复制相关文章
相似问题
腾讯云开发者

Copyright © 2013 - 2026 Tencent Cloud. All Rights Reserved. 腾讯云 版权所有
深圳市腾讯计算机系统有限公司 ICP备案/许可证号:粤B2-20090059 ![]() 粤公网安备44030502008569号
粤公网安备44030502008569号
腾讯云计算(北京)有限责任公司 京ICP证150476号 | 京ICP备11018762号