
Tradingview多安全策略及其解决方案
Tradingview多安全策略及其解决方案
提问于 2021-09-18 20:54:11
我有一个基本的松木脚本,提供以下参考,有两个概念,我想帮助澄清。
- 如何设置此策略的分辨率,以便我可以查看1Y、5y、YTD等图表,但总是在特定的分辨率上运行策略(例如,每日条)。我在这方面做了几次尝试,您可以在代码中看到注释,但我不认为它工作正常;我想看看更有经验的人是如何做到这一点的。
- 我想写一个同时分析多个证券的策略,但是我在Tradingview中找不到一个很好的方法来做到这一点。我以前使用过Quantconnect,在这个系统中,我可以选择任何数量的我想要使用的证券。例如,下面的策略是相对较低的交易频率(大约每年4次),所以我想使用多种证券来执行此策略,以减少停机时间。这对我来说是一个很大的缺点,因为我无法执行一项分析和交易多种证券的策略。
。
我很感激你能提供的一切帮助。下面提供了引用的代码。
    //@version=4
strategy(title="Basic Bollinger",
     overlay=true,
     default_qty_type=strategy.percent_of_equity,
     default_qty_value=95)

// Strategy Rules:
// 1. Enter trade when price crosses above the lower band
// 2. Exit trade when price touches the upper band
//

// Chart Properties
testStartYear = input(2018, "Backtest Start Year")
testStartMonth = input(1, "Backtest Start Month")
testStartDay = input(1, "Backtest Start Day")
testPeriodStart = timestamp(testStartYear, testStartMonth, testStartDay, 0, 0)

testStopYear = input(2021, "Backtest Stop Year")
testStopMonth = input(1, "Backtest Stop Month")
testStopDay = input(1, "Backtest Stop Day")
testPeriodStop = timestamp(testStopYear, testStopMonth, testStopDay, 0, 0)

// A switch to control background coloring of the test period
testPeriodBackground = input(title="Color Background?", type=input.bool, defval=true)
testPeriodBackgroundColor = testPeriodBackground and time >= testPeriodStart and time <= testPeriodStop ? #6c6f6c : na
bgcolor(testPeriodBackgroundColor, transp=97)

// User provided values
smaLength = input(title="SMA Length", type=input.integer, defval=20) // Middle band period length (moving average)
stdLength = input(title="StdDev Length", type=input.integer, defval=20) // Range to apply bands to
ubOffset = input(title="Upper Band Offset", type=input.float, defval=2.0, step=0.5) // Number of standard deviations above MA
lbOffset = input(title="Lower Band Offset", type=input.float, defval=2.0, step=0.5) // Number of standard deviation below MA
res = input(title='Resolution', type=input.resolution, defval='1D') // Resolution

testPeriod() =>
    time >= testPeriodStart and time <= testPeriodStop ? true : false

//closePrice = security(syminfo.tickerid, res, close)
stdDev = stdev(close, stdLength) // security(syminfo.tickerid, res, stdev(close, stdLength)) // Standard Deviation
smaValue = sma(close, smaLength) // security(syminfo.tickerid, res, sma(close, smaLength)) // Middle band
upperBand = smaValue + stdDev * ubOffset // Top band
lowerBand = smaValue - stdDev * lbOffset // Bottom band

// Plot Bands
plot(series=smaValue, title="SMA", color=color.blue)
plot(series=upperBand, title="UB", color=color.green, linewidth=2)
plot(series=lowerBand, title="LB", color=color.red, linewidth=2)

longCondition = (crossover(close, lowerBand))
closeLongCondition = (close >= upperBand)

if (longCondition and testPeriod())
    strategy.entry(id="CALL", long=true)

strategy.close(id="CALL", when=closeLongCondition)回答 1
Stack Overflow用户
发布于 2021-09-19 04:00:01
表示1号
您需要做的是使用tradingview的security()函数将所有src值替换为每日分辨率,如下所示:
src = security(syminfo.ticker, "D", close)然后,只需将所有的close替换为src,现在无论您在什么时间范围内,它都应该可以工作。
但是请注意,当您进入比每天更高的时间框架时,会丢失数据,这是因为security()不打算用于从较低的时间框架导入数据。
表示数字2
您可以创建像这样的筛选器:
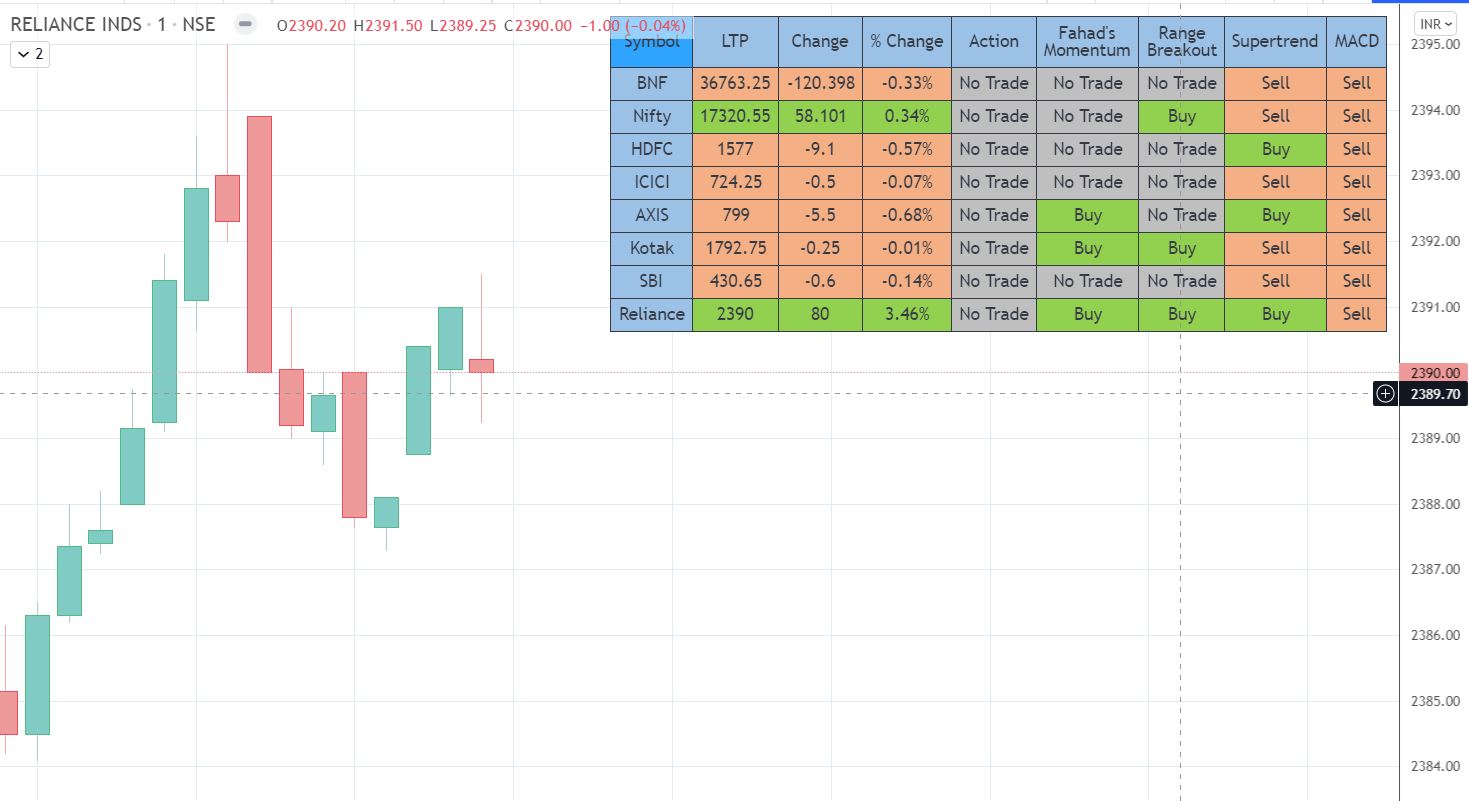
这也可以使用security()函数来完成。下面是一个例子:
ema_5 = ema(close, 5)
getConditions()=>
    buy = crossover(close, ema_5)
    sell = crossunder(close, ema_5)
    [buy, sell]

[btc_buy, btc_sell] = security("BINANCE:BTCUSDTPERP", timeframe.period, getConditions())
[ltc_buy, ltc_sell] = security("BINANCE:LTCUSDTPERP", timeframe.period, getConditions())
[eth_buy, eth_sell] = security("BINANCE:ETHUSDTPERP", timeframe.period, getConditions())
然后,您可以使用这些值在表或其他上显示它。
但是,如果你只是想分析净利润%,利润因素或回溯不同的符号和时间框架与你的战略脚本,那么你将需要一个网络刮刀。您可以为您构建一个这样的程序,而不是一个一个地手动检查每个符号和时间框架。
页面原文内容由Stack Overflow提供。腾讯云小微IT领域专用引擎提供翻译支持
原文链接:
https://stackoverflow.com/questions/69238367
复制相关文章
相似问题
腾讯云开发者

Copyright © 2013 - 2026 Tencent Cloud. All Rights Reserved. 腾讯云 版权所有
深圳市腾讯计算机系统有限公司 ICP备案/许可证号:粤B2-20090059 ![]() 粤公网安备44030502008569号
粤公网安备44030502008569号
腾讯云计算(北京)有限责任公司 京ICP证150476号 | 京ICP备11018762号