
升级到ggplot2 3.3.4后意外的颜色更改
升级到ggplot2 3.3.4后意外的颜色更改
提问于 2021-11-26 10:44:17
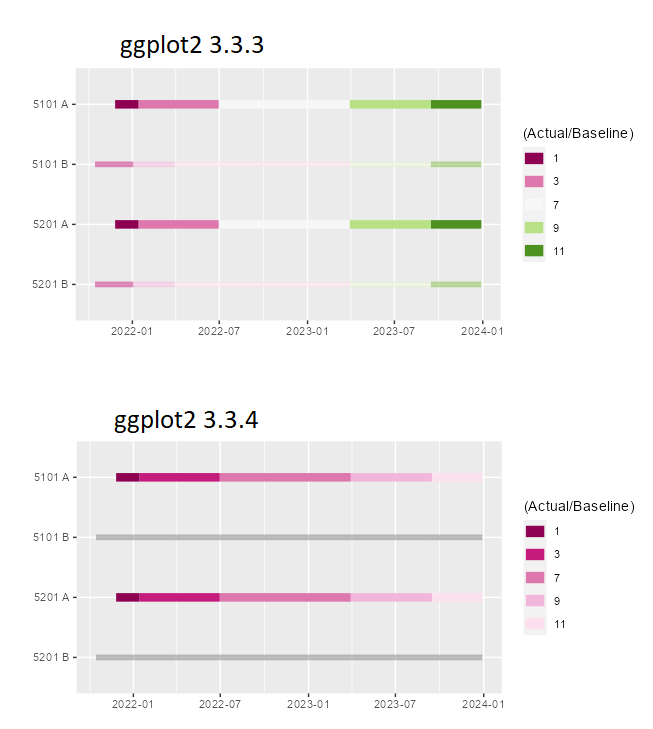
图中显示了将ggplot2从3.3.3版本升级到ver之前和之后的差异。3.3.4
library(RColorBrewer)
library(ggplot2)

df <- structure(list(name = structure(c(11L, 11L, 11L, 11L, 11L, 11L,
11L, 11L, 11L, 11L, 9L, 9L, 9L, 9L, 9L, 9L, 9L, 9L, 9L, 9L, 12L,
12L, 12L, 12L, 12L, 12L, 12L, 12L, 12L, 12L, 10L, 10L, 10L, 10L,
10L, 10L, 10L, 10L, 10L, 10L), .Label = c("5303 B", "5303 A",
"5302 B", "5302 A", "5301 B", "5301 A", "5202 B", "5202 A", "5201 B",
"5201 A", "5101 B", "5101 A"), class = "factor"), stadio = c(2,
2, 4, 4, 6, 6, 8, 8, 10, 10, 2, 2, 4, 4, 6, 6, 8, 8, 10, 10,
1, 1, 3, 3, 7, 7, 9, 9, 11, 11, 1, 1, 3, 3, 7, 7, 9, 9, 11, 11
), variable = structure(c(1L, 2L, 1L, 2L, 1L, 2L, 1L, 2L, 1L,
2L, 1L, 2L, 1L, 2L, 1L, 2L, 1L, 2L, 1L, 2L, 1L, 2L, 1L, 2L, 1L,
2L, 1L, 2L, 1L, 2L, 1L, 2L, 1L, 2L, 1L, 2L, 1L, 2L, 1L, 2L), .Label = c("start_date",
"end_date"), class = "factor"), value = c("15/10/2021", "03/01/2022",
"03/01/2022", "30/03/2022", "30/03/2022", "30/03/2023", "30/03/2023",
"15/09/2023", "15/09/2023", "29/12/2023", "15/10/2021", "03/01/2022",
"03/01/2022", "30/03/2022", "30/03/2022", "30/03/2023", "30/03/2023",
"15/09/2023", "15/09/2023", "29/12/2023", "26/11/2021", "14/01/2022",
"14/01/2022", "30/06/2022", "30/06/2022", "30/03/2023", "30/03/2023",
"15/09/2023", "15/09/2023", "29/12/2023", "26/11/2021", "14/01/2022",
"14/01/2022", "30/06/2022", "30/06/2022", "30/03/2023", "30/03/2023",
"15/09/2023", "15/09/2023", "29/12/2023"), rating = structure(c(1L,
1L, 1L, 1L, 1L, 1L, 1L, 1L, 1L, 1L, 1L, 1L, 1L, 1L, 1L, 1L, 1L,
1L, 1L, 1L, 2L, 2L, 2L, 2L, 2L, 2L, 2L, 2L, 2L, 2L, 2L, 2L, 2L,
2L, 2L, 2L, 2L, 2L, 2L, 2L), .Label = c("2", "3"), class = "factor")), row.names = c(NA,
-40L), class = c("tbl_df", "tbl", "data.frame"))

ggplot(df, aes(as.POSIXct(as.Date(value, "%d/%m/%Y")), name, colour = factor(stadio,levels=1:11))) +
  guides(alpha = "none",
         colour = guide_legend(
           override.aes = list(size = 4))) +
  geom_line(aes(size=rating, alpha=rating)) +
  scale_alpha_manual(values=c(.5,1)) +
  labs(colour="(Actual/Baseline)", x = "", y = "") +
  scale_colour_manual(breaks = c("1", "3", "7","9","11"), values = brewer.pal(11,"PiYG")) +
scale_size_manual(breaks = levels(df$rating), values = as.integer(levels(df$rating)), guide = "none") 回答 1
Stack Overflow用户
回答已采纳
发布于 2021-11-26 14:57:21
从帮助中:
“值:将数据值映射到的一组美学值。这些值将按照比例的限制(通常按字母顺序排列)进行匹配,或者如果提供中断,则与之匹配。如果这是一个命名的向量,那么这些值将根据名称进行匹配。不匹配的数据值将被赋予na.value。”
所以在这一行:
scale_colour_manual(breaks = c("1", "3", "7","9","11"), values = brewer.pal(11,"PiYG"))您已经定义了5个断点,所以ggplot只使用调色板的前5种颜色。如果您移除"breaks =c“(”1“、"3”、"7“、"9”、" 11 ")“情节是正确的,但图例并不显示所有的11个值。
若要绘制所有11种颜色并使图例只显示图例中值的一半,您需要定义一个函数来选择要显示的值。
oddones <- function(x) {
   ifelse(as.integer(x)%%2, x, "")
}

ggplot(df, aes(as.POSIXct(as.Date(value, "%d/%m/%Y")), name, colour = factor(stadio,levels=1:11))) +
   guides(alpha = "none",  colour = guide_legend(override.aes = list(size = 4))) +
   geom_line(aes(size=rating, alpha=rating)) +
   scale_alpha_manual(values=c(.5,1)) +
   labs(colour="(Actual/Baseline)", x = "", y = "") +
   scale_colour_manual(breaks = oddones, values = brewer.pal(11,"PiYG")) +
scale_size_manual(breaks = levels(df$rating), values = as.integer(levels(df$rating)), guide = "none") 页面原文内容由Stack Overflow提供。腾讯云小微IT领域专用引擎提供翻译支持
原文链接:
https://stackoverflow.com/questions/70123164
复制相关文章
相似问题
腾讯云开发者

Copyright © 2013 - 2026 Tencent Cloud. All Rights Reserved. 腾讯云 版权所有
深圳市腾讯计算机系统有限公司 ICP备案/许可证号:粤B2-20090059 ![]() 粤公网安备44030502008569号
粤公网安备44030502008569号
腾讯云计算(北京)有限责任公司 京ICP证150476号 | 京ICP备11018762号