
在DENEB直方图上添加下限和上限规格垂直线[VEGA]
在DENEB直方图上添加下限和上限规格垂直线[VEGA]
提问于 2022-11-01 13:26:43
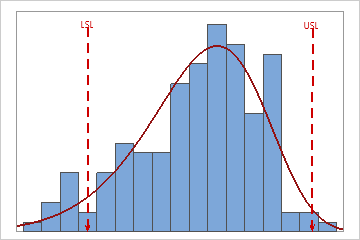
你好!我正在处理关于Power的数据分析。因为最近这个平台删除了柱状图,我正在尝试使用Deneb,这是一个基于Vega的定制视觉。我想要建立一个直方图,平均,较低的规格限制(LSL)和上限(USL)。我的结果是动态的,因为有许多产品我正在工作。每种产品都有pH、重量、浓度等分析,每种分析都有自己的LSL和USL (例如: pH 7.0至8.5,浓度1,3 ~ 2,9 %,重量120 ~ 300 mg,均适用于产品A)。
我看了https://www.youtube.com/watch?v=67ucnNrMHgY的视频,这对我很有帮助!但我仍然不能添加LSL和USL,因为我是织女星世界的新手。
{
  "description": "Histogram",
  "data": {"name": "dataset"},
  "layer": [
    {
      "mark": {
        "type": "bar",
        "color": "#377eb8",
        "tooltip": true
      },
      "encoding": {
        "x": {
          "field": "RESULTS",
          "bin": {"maxbins": 10
          },
          "title": "RESULTS"
        },
        "y": {
          "aggregate": "count",
          "title": "ABSOLUTE FREQUENCE"
        }
      }
    },
    {
      "mark": "rule",
      "encoding": {
        "x": {
          "aggregate": "mean",
          "field": "RESULTS"
          },
          "color": {"value": "red"},
          "size": {"value": 3}
        }
    }
              ]
    }
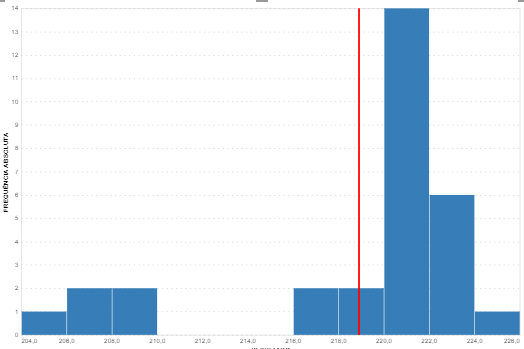
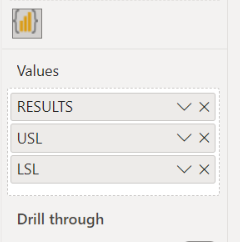
我如何添加垂直线与我的限制?它们是关于动力BI的措施。我无法修正一个值,因为值的变化与分析一致。
How to add vertical Rule with constant value to Vega Lite chart?这个问题类似于我的问题,但不幸的是,它并没有帮助我。
回答 1
Stack Overflow用户
发布于 2022-11-30 14:57:14
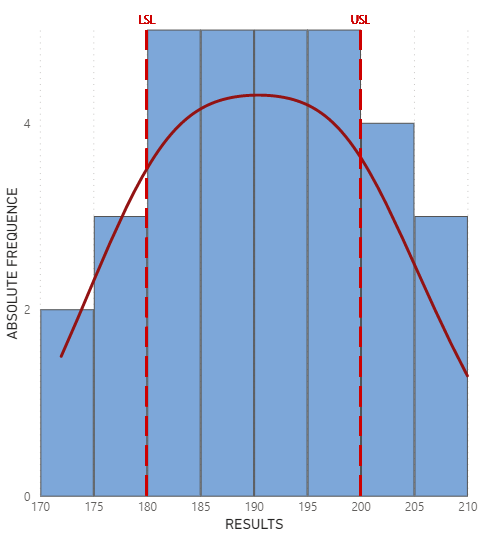
只需将与USL和LSL的度量传递到可视化中,并在Vega规范中的规则标记中引用它们。
{
  "data": {"name": "dataset"},
  "layer": [
    {
      "description": "Histogram bars",
      "mark": {
        "type": "bar",
        "color": "#7DA7D9",
        "stroke": "#515151",
        "strokeWidth": 1,
        "tooltip": true
      },
      "encoding": {
        "x": {
          "field": "RESULTS",
          "bin": {"maxbins": 10},
          "title": "RESULTS"
        },
        "y": {
          "aggregate": "count",
          "field": "RESULTS",
          "type": "quantitative",
          "title": "ABSOLUTE FREQUENCE"
        }
      }
    },
    {
      "description": "Histogram line",
      "transform": [
        {
          "density": "RESULTS",
          "bandwidth": 5,
          "as": ["values", "density"]
        }
      ],
      "mark": {
        "type": "line",
        "color": "#931313",
        "strokeWidth": 3,
        "tooltip": true
      },
      "encoding": {
        "x": {
          "field": "values",
          "type": "quantitative"
        },
        "y": {
          "field": "density",
          "type": "quantitative",
          "axis": null
        }
      }
    },
    {
      "description": "USL line",
      "mark": {
        "type": "rule",
        "strokeDash": [20, 10]
      },
      "encoding": {
        "x": {
          "field": "USL",
          "type": "quantitative"
        },
        "color": {"value": "#CE0000"},
        "size": {"value": 2}
      }
    },
    {
      "description": "USL label",
      "mark": {
        "type": "text",
        "align": "center",
        "fontWeight": 100,
        "color": "#CE0000"
      },
      "encoding": {
        "x": {
          "field": "USL",
          "type": "quantitative"
        },
        "y": {"value": -10},
        "text": {"value": "USL"}
      }
    },
    {
      "description": "LSL line",
      "mark": {
        "type": "rule",
        "strokeDash": [20, 10]
      },
      "encoding": {
        "x": {
          "field": "LSL",
          "type": "quantitative"
        },
        "color": {"value": "#CE0000"},
        "size": {"value": 2}
      }
    },
    {
      "description": "LSL label",
      "mark": {
        "type": "text",
        "align": "center",
        "fontWeight": 100,
        "color": "#CE0000"
      },
      "encoding": {
        "x": {
          "field": "LSL",
          "type": "quantitative"
        },
        "y": {"value": -10},
        "text": {"value": "LSL"}
      }
    }
  ],
  "resolve": {
    "scale": {"y": "independent"}
  }
}页面原文内容由Stack Overflow提供。腾讯云小微IT领域专用引擎提供翻译支持
原文链接:
https://stackoverflow.com/questions/74276673
复制相关文章
相似问题
腾讯云开发者

Copyright © 2013 - 2026 Tencent Cloud. All Rights Reserved. 腾讯云 版权所有
深圳市腾讯计算机系统有限公司 ICP备案/许可证号:粤B2-20090059 ![]() 粤公网安备44030502008569号
粤公网安备44030502008569号
腾讯云计算(北京)有限责任公司 京ICP证150476号 | 京ICP备11018762号