
RSI图大于价格图(PineScript)
RSI图大于价格图(PineScript)
提问于 2022-10-09 21:21:02
专家们,
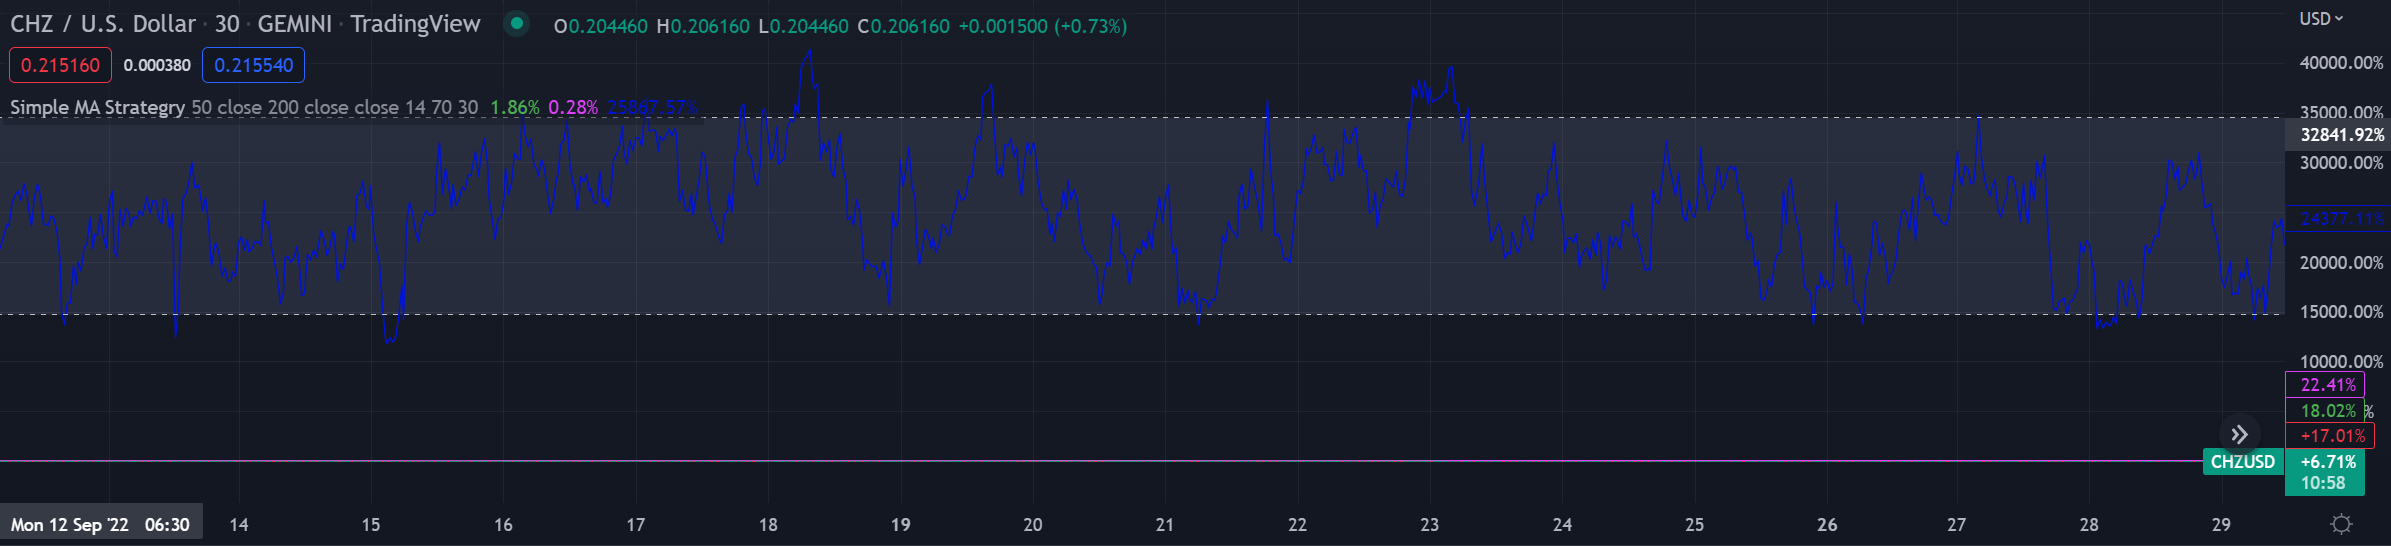
我的第一个PineScript图有一个问题,那就是RSI图比价格图大得多(见屏幕截图)。你知道我怎么才能把RSI图移到底部让它变小吗?
//@version=5
strategy("Simple MA Strategy", overlay=true, initial_capital=10000)

// Date range
startDate = timestamp(2000, 01, 01, 0, 0, 0)

// Define inputs
ema1Value = input(title="EMA 1", defval=50)
ema1Source = input(title="EMA 1 Source", defval=close)
ema2Value = input(title="EMA 2",defval=200)
ema2Source = input(title="EMA 2 Source", defval=close)
rsiSource = input(title="RSI Source", defval=close)
rsiLength = input(title="RSI Length",defval=14)
rsiOverboughtLevel = input(title="RSI Overbought Level", defval=70)
rsiOversoldLevel = input(title="RSI Oversold Level", defval=30)

// Indicators
ema1 = ta.ema(ema1Source, ema1Value)
ema2= ta.ema(ema2Source, ema2Value)
rsi = ta.rsi(rsiSource,14)
rsiValue = ta.rsi(rsiSource, rsiLength)

// Rules
ema_crossover = ta.crossover(ema1, ema2)
ema_crossunder = ta.crossunder(ema1, ema2)
isRsiOverbought = rsiValue >= rsiOverboughtLevel
isRsiOversold = rsiValue <= rsiOversoldLevel


// Plot indicators & levels
plot(ema1, color=color.green,linewidth = 1)
plot(ema2, color=color.fuchsia,linewidth = 1)

plot(rsi, "RSI", color=color.rgb(0, 18, 212))
rsiOversoldLine = hline(rsiOverboughtLevel, "OerSold", color=#C0C0C0)
rsiOverboughtLine = hline(rsiOversoldLevel, "OverBought", color=#C0C0C0)
fill(rsiOversoldLine, rsiOverboughtLine, color=color.rgb(147, 163, 208, 86), title="Background")回答 1
Stack Overflow用户
发布于 2022-10-09 21:22:36
您应该使用适当的overlay标志设置为false,从而在不同的面板中绘制RSI。
strategy("Simple MA Strategy", overlay=false, initial_capital=10000)页面原文内容由Stack Overflow提供。腾讯云小微IT领域专用引擎提供翻译支持
原文链接:
https://stackoverflow.com/questions/74008435
复制相关文章
相似问题
腾讯云开发者

Copyright © 2013 - 2026 Tencent Cloud. All Rights Reserved. 腾讯云 版权所有
深圳市腾讯计算机系统有限公司 ICP备案/许可证号:粤B2-20090059 ![]() 粤公网安备44030502008569号
粤公网安备44030502008569号
腾讯云计算(北京)有限责任公司 京ICP证150476号 | 京ICP备11018762号