
R刚时间序列-图中的奇异时间轴
我正在调查新南威尔士州区域内的环境空气污染情况,并进行每日一次的时间序列分解分析,以调查新冠肺炎封锁前后是否存在变化点标志。
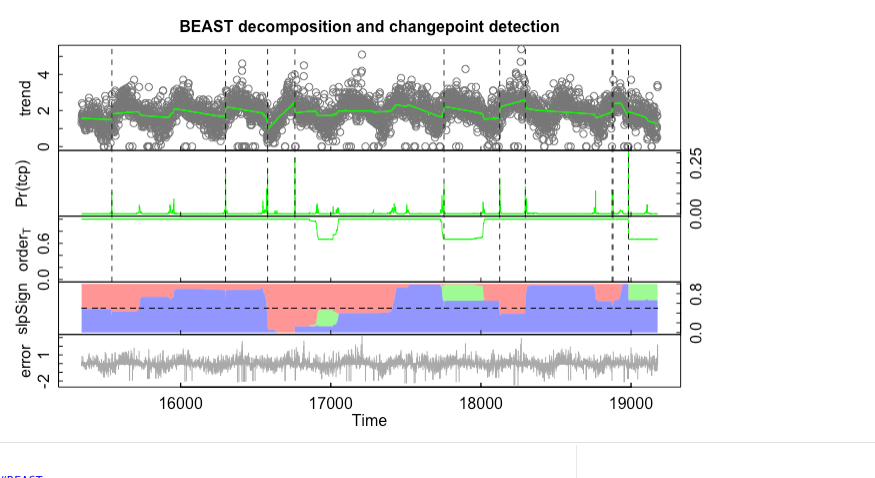
我创建了一个循环代码来分析每个区域内每种污染物的数据--然而,野兽X轴(“日期”--即01-01-2021 -理想的地块年份(2012-2022) )正在奇怪地绘制(即时间= 16000、17000、18000等)。
有人知道怎么解决这个问题吗?
beast_output = list()

target_pollutants = c("PM10", "OZONE", "NO", "NO2")
target_sites = c("WOLLONGONG", "MUSWELLBROOK", "SINGLETON", "CAMBERWELL", "WAGGAWAGGANORTH", "RICHMOND", "CAMDEN", "CHULLORA", "EARLWOOD",  "WALLSEND", "BERESFIELD", "BARGO", "BRINGELLY", "PROSPECT", "STMARYS", "OAKDALE", "RANDWICK", "ROZELLE", "NEWCASTLE", "KEMBLAGRANGE", "ALBIONPARKSOUTH")
for (poll in target_pollutants) {
  beast_output[[poll]] = list()
  df = time_by_poll[[poll]]  #  grab the target df
  sites = colnames(df)
  sites$Date = NULL  #  clear date from the list
  for (site in sites) {
    ts = ts(df[[site]], start=min(df$Date), end=max(df$Date))
    beast_results = beast(ts)
    # plot(beastie_resulty)
    beast_output[[poll]][[site]] = beast_results
  }
}


plot (beast_results[["OZONE"]][["RANDWICK"]])
回答 1
Stack Overflow用户
发布于 2022-07-18 04:51:28
谢谢你对这个问题的提问和抱歉。事实上,R极体中的API接口有点混乱,因为它最初是为处理卫星时间序列而编写的。
无论如何,软件包中的野兽模型只是为规则的时间序列制定的。(所谓规则,我指的是等间距的时间序列,每个周期的数据点数相同)。由于闰年有366天,而其他年份则有356天,如果周期为一年,则将日时间序列按不规则时间序列处理。但是,如果周期变化是每周/7天,则认为每日时间序列是有规律的。为了处理不规则的时间序列,在进行分解和转换点检测之前,我实现了接受不规则输入并将它们聚合成规则时间序列的beast.irreg函数。
为了举例说明,我从这个站点PM10获得了几个区域(例如,卧龙“和"MUSWELLBROOK")的样本https://www.dpie.nsw.gov.au/air-quality/air-quality-data-services/data-download-facility数据集,我在https://github.com/zhaokg/Rbeast/tree/master/R/SampleData下发布了CSV文件(以及关于臭氧的另一个数据集)。您可以直接从R中读取文件,如下所示:
df = read.csv('https://github.com/zhaokg/Rbeast/raw/master/R/SampleData/pm10_1658112168.csv',header=FALSE,skip=3)
dates = as.Date(df[,1], "%d/%m/%Y") # the 1st col is dates
Y = df[,2:ncol(df)] # the rest are PM10 data for the several sample sites
# e.g., Y[,1] for the first region (WOLLONGONG)
library(Rbeast)
o = beast.irreg(log(Y[,1]),time=dates,deltat=1/12, freq=12, tseg.min=3, sseg.min=6)
# log(Y[,1]) : Log-transformation may help if data is skewed bcz the BEAST model
assumes Gaussian errors;
# time=dates : Use the 'time' arg to supply the times of individual data points.
Alternatively, the `beast123' function also handles date strings of different formats
# deltat=1/12: Aggregate the daily time series into a regular one at the interval
of 1 month=1/12 year
# freq=12 : The period is 1 year, which is 12 data points (1.0/deltat=12)
# tseg.min: The minimum trend segment length allowed in the changepoint detection is 3 data points (3 months)
-- the results MAY be sensitive to this parameter
# sseg.min: The minimum seasonal segment length allowed in the changepoint detection is 6 data points (6 months)
-- the results MAY be sensitive to this parameter
plot(o)
# For sure, the daily time series can be re-sampled/aggregated to a different time interval
# Below, it is aggregated into a half monthly time series (dT=1/24 year), and the number
# of data points per period is freq=1.0 year/dT=24
o = beast.irreg( log(Y[,1]),time=dates, deltat = 1/24, freq=24, tseg.min=12, sseg.min=12)
plot(o)
# Aggregated to a weekly time series (e.g., dT=7 / 365 year: the unit again is year),
# and freq=1 year/ dT = 365/7.
# tcp.minmax=c(0,10) : the min and max numbers of changepoints allowed in the trend component
o = beast.irreg( log(Y[,1]),time=dates,deltat=7/365,freq=365/7, tcp.minmax=c(0,15),tseg.min=5, sseg.min=20,ocp=10)
plot(o)
# Finally if you want to run on the daily interval. Specify the dT=deltat=1/365 year, and
# freq = period/dT= 1.0 year/(1/365)year =365. Bcz the raw data is daily,
# the majority of the raw data is kept intact during the aggregation except when
# there is a leap year (the last two days of the leap year are merged into a single day)
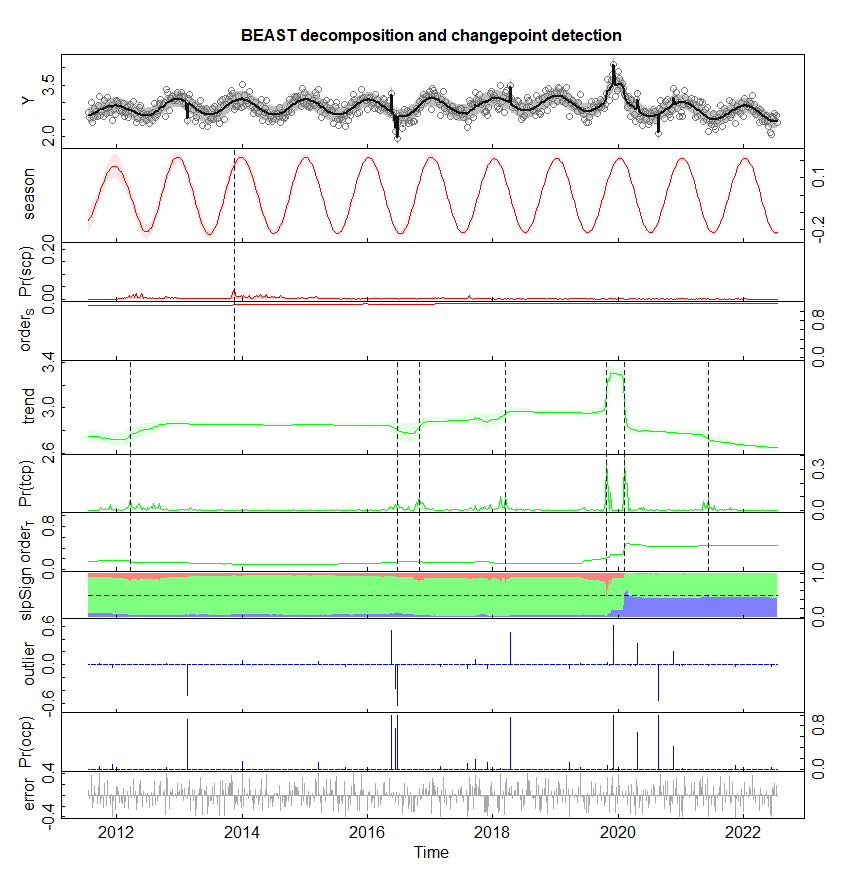
o = beast.irreg( log(Y[,1]),time=dates, deltat = 1/365, freq=365/1, tseg.min=30, sseg.min=180)
plot(o)默认情况下,时间序列被分解为Y= season + trend + error,但是对于原始规模的数据集(例如,不进行日志转换),可能会出现一些尖峰。建模的一种方法是添加一个额外的尖峰/离群点组件:Y=season+trend+outlier/spike-like+error
# Use 'ocp' to specify the maximum number of spikes (either upward or downward) to be allowed in the outlier/spike component

o = beast.irreg(Y[,1],time=dates,  deltat = 1/365, freq=365/1,  tseg.min=30, sseg.min=180, ocp=10)
plot(o)
下面是每周分析一次时间序列的一个例子(同样,根据tseg.min或sseg.min的选择,精确的结果也不同)。
更重要的是,我从您的数字中注意到的另一个问题是,您的数据似乎有很多缺失的值,这些值应该被分配给NA,而不是分配给您的图形中的零。如果是这样的话,分析结果肯定是错误的。野兽可以处理丢失的数据,而这些缺失的值应该被赋予NA或NAN (例如,Y[Y==0]=NA)。
https://stackoverflow.com/questions/72976861
复制相似问题
腾讯云开发者

Copyright © 2013 - 2026 Tencent Cloud. All Rights Reserved. 腾讯云 版权所有
深圳市腾讯计算机系统有限公司 ICP备案/许可证号:粤B2-20090059 ![]() 粤公网安备44030502008569号
粤公网安备44030502008569号
腾讯云计算(北京)有限责任公司 京ICP证150476号 | 京ICP备11018762号