
R中的规范梯度echarts4r
R中的规范梯度echarts4r
提问于 2022-07-01 01:27:50
我需要在r中创建一个量规图,但是我不能在渐变颜色中创建"axisLine“函数。
library(echarts4r)
gauge_x <- e_charts() %>%
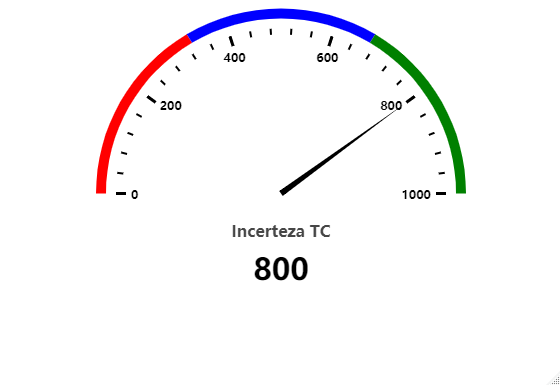
e_gauge(800,
"Incerteza TC",
startAngle = 180,
endAngle = 0,
min = 0,
max = 1000,
splitNumber = 5,
radius = "185",
itemStyle = list(color = "#000000"),
#axisLine = list(lineStyle = list(color = list(type = "radial", x = "0.5", y = "0.5", r = "0.5",
#backgroundColor = radial_gradient))),
axisTick = list(lineStyle = list(width = 2, color = "#000000")),
splitLine = list(lineStyle = list(color = "#000000", type = "solid")),
axisLabel = list(show = TRUE, color = "#000000", fontWeight = "bold", borderRadius = 5),
pointer = list(show = TRUE, icon = "triangle", length = "80%"), itemStyle = list(color = "black"),
detail = list(show = TRUE, color = "#000000"),
title = list(show = TRUE, fontWeight = "bolder"))
print(gauge_x)回答 1
Stack Overflow用户
发布于 2022-07-12 17:32:49
正如我在文档中看到的那样,不能在表图中为axisLine颜色指定渐变颜色或任何图案填充。只能为段指定颜色数组。根据文件,
量规图的轴线可分为几段,以不同的颜色。每个段的结束位置和颜色可以用数组表示。
因此,您只能通过以下方式指定包含百分比和相应颜色的向量列表来对axisLine进行着色:
library(echarts4r)
library(magrittr)


e_charts() %>%
    e_gauge(
        800,
        "Incerteza TC",
        startAngle = 180,
        endAngle = 0,
        min = 0,
        max = 1000,
        splitNumber = 5,
        radius = "185",
        itemStyle = list(color = "#000000"),
        axisLine = list(lineStyle = list(
            color = list(c(0.33, "red"), c(0.67, "blue"), c(1, "green"))
        )),
        axisTick = list(lineStyle = list(width = 2, color = "#000000")),
        splitLine = list(lineStyle = list(color = "#000000", type = "solid")),
        axisLabel = list(
            show = TRUE,
            color = "#000000",
            fontWeight = "bold",
            borderRadius = 5
        ),
        pointer = list(show = TRUE, icon = "triangle", length = "80%"),
        itemStyle = list(color = "black"),
        detail = list(show = TRUE, color = "#000000"),
        title = list(show = TRUE, fontWeight = "bolder")
    )
希望这能有所帮助!
页面原文内容由Stack Overflow提供。腾讯云小微IT领域专用引擎提供翻译支持
原文链接:
https://stackoverflow.com/questions/72823548
复制相关文章
相似问题
腾讯云开发者

Copyright © 2013 - 2026 Tencent Cloud. All Rights Reserved. 腾讯云 版权所有
深圳市腾讯计算机系统有限公司 ICP备案/许可证号:粤B2-20090059 ![]() 粤公网安备44030502008569号
粤公网安备44030502008569号
腾讯云计算(北京)有限责任公司 京ICP证150476号 | 京ICP备11018762号