
ggplot2直方图中回收箱颜色的变化
ggplot2直方图中回收箱颜色的变化
提问于 2022-03-31 22:53:45
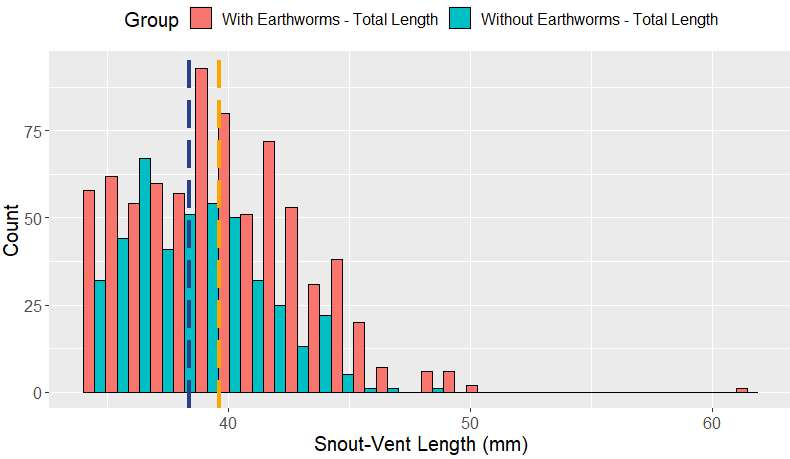
我正在试图改变的颜色的回收箱,根据组,其中一个to图柱状图。我看到回收箱的轮廓是在geom_histogram(color="black")中指定的,但不确定如何更改回收箱本身的填充颜色。
以下是代码:
ggplot(
  Size_Comparison_Proper_Without_Juveniles\_,
  aes(x=values, fill=group)
  ) +
geom_histogram(
  position="dodge",
  alpha = 1,
  bins=30,
  color="black")+
labs(
  title='Total Length at Earthworm Sites \\n vs Total Length at Earthworm-Free Sites',
  y='Count',
  x='Snout-Vent Length (mm)')+
theme(
  legend.position="top",
  text = element_text(size=15))+
scale_fill_discrete(
    name="Group",
    labels=c("With Earthworms - Total Length","Without Earthworms - Total Length"))+
geom_vline(
    xintercept=38.39,
    color="royalblue4",
    size=1.5,
    linetype="longdash")+
geom_vline(
    xintercept=39.62583,
    color="orange",
    size=1.5,
    linetype="longdash")
谢谢你!!
我只试过玩aes(color="")和geom_histogram(color="")
    structure(list(EW = c(34, 42, 34, 34, 34, 39), noEW = c(36, 35,
39, 35, 36, 38), values = c(34, 42, 34, 34, 34, 39), group = c("Tot_ew",
"Tot_ew", "Tot_ew", "Tot_ew", "Tot_ew", "Tot_ew")), row.names = c(NA,
-6L), class = c("tbl_df", "tbl", "data.frame"))回答 1
Stack Overflow用户
回答已采纳
发布于 2022-04-01 04:05:22
正如@Bloxx所指出的,您可以使用scale_fill_manual。但是,您不需要两者都需要,因此我们可以替换另一个scale_fill_discrete。
library(tidyverse)

ggplot(df,
       aes(x = values, fill = group)) +
  geom_histogram(position = "dodge", alpha = 1, bins = 30, color = "black") +
  labs(title = 'Total Length at Earthworm Sites \\n vs Total Length at Earthworm-Free Sites',
       y = 'Count',
       x = 'Snout-Vent Length (mm)') +
  theme(legend.position = "top",
        text = element_text(size = 15)) +
  scale_fill_manual(
    name = "Group",
    labels = c(
      "With Earthworms - Total Length",
      "Without Earthworms - Total Length"
    ),
    values = c("dark blue", "light blue")
  ) +
  geom_vline(xintercept = 38.39, color = "royalblue4", size = 1.5, linetype = "longdash") +
  geom_vline(xintercept = 39.62583, color = "orange", size = 1.5, linetype = "longdash")
输出
数据
df <- structure(list(EW = c(34, 42, 34, 34, 34, 39, 35, 36, 37, 38,
40), noEW = c(36, 35, 39, 35, 36, 38, 35, 36, 37, 38, 40), values = c(34,
42, 34, 34, 34, 39, 35, 36, 37, 38, 40), group = c("Tot_ew",
"Tot_ew", "Tot_ew", "Tot_woew", "Tot_woew", "Tot_woew", "Tot_ew",
"Tot_ew", "Tot_ew", "Tot_woew", "Tot_woew")), row.names = c(NA,
-11L), class = c("tbl_df", "tbl", "data.frame"))页面原文内容由Stack Overflow提供。腾讯云小微IT领域专用引擎提供翻译支持
原文链接:
https://stackoverflow.com/questions/71699976
复制相关文章
相似问题
腾讯云开发者

Copyright © 2013 - 2026 Tencent Cloud. All Rights Reserved. 腾讯云 版权所有
深圳市腾讯计算机系统有限公司 ICP备案/许可证号:粤B2-20090059 ![]() 粤公网安备44030502008569号
粤公网安备44030502008569号
腾讯云计算(北京)有限责任公司 京ICP证150476号 | 京ICP备11018762号