
BarPlot取值范围
BarPlot取值范围
提问于 2022-03-12 09:13:22
我有以下范围的间隔,我想要绘制在一个酒吧。我该怎么做呢?
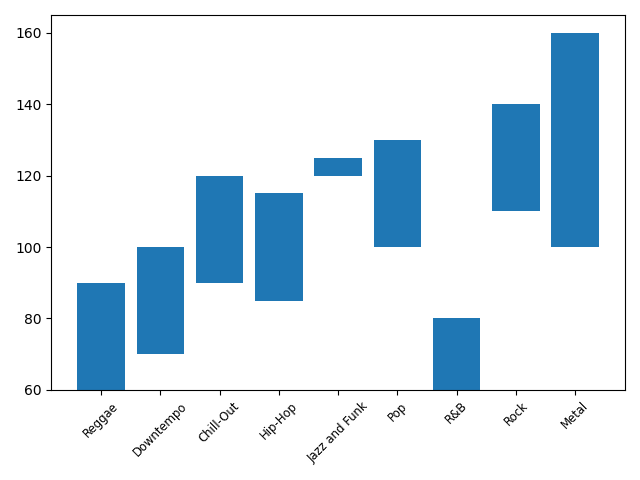
#   • Reggae: Reggae genre has a typical BPM ranging from 60-90
#   • Downtempo: For this genre, it has a typical BPM between 70-100
#   • Chill-Out: This genre has a typical BPM between 90-120
#   • Hip-Hop: This genre has a typical BPM between 85-115
#   • Jazz and Funk: This genre has a typical BPM between 120-125
#   • Pop: For this genre, it has a typical BPM between 100-130
#   • R&B: For this genre, it has a typical BPM between 60-80
#   • Rock: For this genre, it has a typical BPM between 110-140
#   • Metal: This genre has a typical BPM between 100-160
到目前为止,我已经这样做了,但它们从0开始,我如何更改代码?
t11 = ['Reggae', 'Downtempo', 'Chill-Out', 'Hip-Hop', 'Jazz and Funk', 'Pop', 'R&B', 'Rock', 'Metal']
t10 = [60, 70,  90,   85, 120, 100, 60, 110, 100]
t12 = [90, 100, 120, 115, 125, 130, 80, 140, 160]


plt.bar(range(len(t12)), t12, align='center')
plt.xticks(range(len(t11)), t11, size='small', rotation=45)

plt.show()回答 1
Stack Overflow用户
回答已采纳
发布于 2022-03-12 09:51:15
我们可以为条形图提供底部和高度,因此让我们从相应的底部值计算每个栏的高度:
import matplotlib.pyplot as plt

t11 = ['Reggae', 'Downtempo', 'Chill-Out', 'Hip-Hop', 'Jazz and Funk', 'Pop', 'R&B', 'Rock', 'Metal']
t10 = [60, 70,  90,   85, 120, 100, 60, 110, 100]
t12 = [90, 100, 120, 115, 125, 130, 80, 140, 160]

plt.bar(range(len(t12)), height=[h-b for h, b in zip(t12, t10)], bottom=t10, align='center')
plt.xticks(range(len(t11)), t11, size='small', rotation=45)

plt.tight_layout()
plt.show()
样本输出:
页面原文内容由Stack Overflow提供。腾讯云小微IT领域专用引擎提供翻译支持
原文链接:
https://stackoverflow.com/questions/71448400
复制相关文章
相似问题
腾讯云开发者

Copyright © 2013 - 2026 Tencent Cloud. All Rights Reserved. 腾讯云 版权所有
深圳市腾讯计算机系统有限公司 ICP备案/许可证号:粤B2-20090059 ![]() 粤公网安备44030502008569号
粤公网安备44030502008569号
腾讯云计算(北京)有限责任公司 京ICP证150476号 | 京ICP备11018762号