从开发到部署:Claude Code 全流程实战

从开发到部署:Claude Code 全流程实战

阿特拉斯
发布于 2026-06-29 10:30:34
发布于 2026-06-29 10:30:34
CI/CD 接入、监控告警——AI 辅助写配置文件的正确姿势
上个月我把一个 15k 行代码、40+ 接口的 Java 微服务从「本地能跑」推到「生产可观测」,全程让 Claude Code 做了 80% 的基建工作。服务跑在阿里云 ACK 1.24(K8s 1.29),最终镜像 167MB,从零配置到 CI/CD 跑通只用了一个下午。
按以前的节奏,这种活我心理预期是 2 天:
• Day 1 上午:写 Dockerfile、调镜像大小、配 docker-compose
• Day 1 下午:搭 CI/CD 流水线、写 K8s 配置
• Day 2 上午:接监控告警、压测调参
实际做完,一个下午收工。
部署本身没变简单——变的是执行层。模板化、规则化的基建工作 AI 更熟,你定义验收标准和关键约束,Claude Code 负责执行和调试。
下面把每个阶段的实操步骤完整走一遍,你可以直接照着改。
一、先说结论:时间省在哪?
阶段 | 传统做法 | Claude Code 工作流 | 耗时 |
|---|---|---|---|
Dockerfile + 镜像优化 | 手写 + 反复 build 调试 | 描述服务特征 → Claude Code 生成 + 多阶段构建 | 2h → 0.5h |
docker-compose 环境 | 手写 + 调试网络/依赖 | Claude Code 生成 + 自动补依赖 | 1h → 0.3h |
CI/CD 流水线 | 读文档 + 手写 YAML | Claude Code 根据项目结构生成 | 3h → 1h |
K8s 部署配置 | 手写 Deployment/Service/Ingress | Claude Code 生成 + 人工审资源限制 | 4h → 1.5h |
监控告警规则 | 装 Prometheus + 手写规则 | Claude Code 读代码生成指标 + 告警规则 | 3h → 1h |
压测 + 调参 | 手动跑 + 看面板 | Claude Code 跑压测脚本 + 建议调参 | 2h → 1h |
合计 | ~15h(约 2 天) | ~5.3h(一个下午) | 节省 ~65% |
真正省时间的机制很简单:你把服务特征描述清楚,Claude Code 把模板化工作填完,你只审关键决策。AI 替你写 YAML 只是表象。
二、为什么部署环节特别适合 Claude Code?
部署环节有几个特征,恰好是 AI 的强项:
1. 模板化程度高:Dockerfile、K8s YAML、CI 配置都有固定模式,AI 训练数据里海量覆盖
2. 规则清晰:端口、环境变量、健康检查、资源限制——都是结构化信息
3. 调试可自动化:build 失败 → 看日志 → 改配置 → 重试,这个循环 Claude Code 能跑
4. 文档齐全:Docker、K8s、GitHub Actions 的文档 AI 都读过
反过来说,不适合 Claude Code 的环节: - 选择技术栈(为什么用 K8s 而不是 Nomad) - 架构决策(服务怎么拆、网络怎么规划) - 安全策略(权限模型、密钥管理策略)
这些仍然是人主导,Claude Code 只提供参考。
2.1 这套流程适用于哪些场景?
适用: - 容器化部署(Docker / K8s) - 有固定技术栈的服务(Java / Go / Node.js / Python 均可,改基础镜像和构建命令即可) - 需要监控告警的生产环境
不完全适用: - Serverless / FaaS 部署(配置模板不同,需适配) - 遗留系统迁移(依赖和构建流程差异大,需人工评估兼容性)
跨平台迁移: - GitHub Actions → GitLab CI / Jenkins:换 CI 模板,Agent 同样能生成 - Java → Go / Node.js / Python:改 CLAUDE.md 里的服务特征,重新生成即可
三、环境准备:10 分钟搭好「Claude Code 施工环境」
3.1 写好 CLAUDE.md 里的部署约束
在项目根目录跑 /init,然后补上部署相关的关键信息:
## 服务特征
- Java 17,Spring Boot 3.x,Maven 构建
- 监听 :8080,需要 PostgreSQL + Redis
- 无状态,水平扩展友好
- JVM 启动参数:-XX:MaxRAMPercentage=75.0 -XX:+UseZGC
## 部署约束
- 基础镜像用 distroless(安全合规要求)
- 镜像大小控制在 200MB 以内
- K8s 资源限制:request 512Mi/250m,limit 1Gi/1000m
- 所有服务必须有 liveness + readiness probe(Spring Boot Actuator 自带)
- CI 用 GitHub Actions,CD 用 ArgoCD
## 禁止
- 不要用 root 用户跑容器
- 不要 hardcode 密钥,统一走 K8s Secret / 环境变量
- 不要在生产环境用 latest tag
这一步的价值: Claude Code 不需要猜你的技术约束,生成的配置直接可用,减少 80% 的来回修改。
四、第一阶段:Docker 化——AI 写 Dockerfile
4.1 让 Claude Code 生成多阶段构建
把服务特征贴给 Claude Code:
这是我的 Java 服务,帮我写一个多阶段构建的 Dockerfile:
- Java 17,Spring Boot 3.x,Maven 构建
- 最终镜像用 gcr.io/distroless/java17-debian12
- 镜像越小越好
- 不要用 root 用户
- 需要 ca-certificates(连 PostgreSQL 用 TLS)
Claude Code 生成的结果:
FROM maven:3.9-eclipse-temurin-17-alpine AS builder
WORKDIR /app
COPY pom.xml .
RUN mvn dependency:go-offline -B
COPY src ./src
RUN mvn package -DskipTests -B
FROM gcr.io/distroless/java17-debian12
COPY --from=builder /app/target/*.jar /app.jar
USER 65534:65534
EXPOSE 8080
ENTRYPOINT ["java", "-XX:+UseZGC", "-XX:MaxRAMPercentage=75.0", "-jar", "/app.jar"]
Claude Code 自动做到的细节:
- 先 COPY pom.xml 单独跑 dependency:go-offline,利用 Docker 层缓存——改代码不重新下载依赖
- Maven 构建用 -DskipTests(测试留给 CI 环节)
- -XX:+UseZGC 低延迟 GC,适合微服务
- -XX:MaxRAMPercentage=75.0 容器环境必备——不用 -Xmx 硬编码,按容器内存动态调整
- USER 65534:65534 distroless 的 nobody 用户
你只需要审: 基础镜像对不对、入口对不对、端口对不对。其他细节 Claud
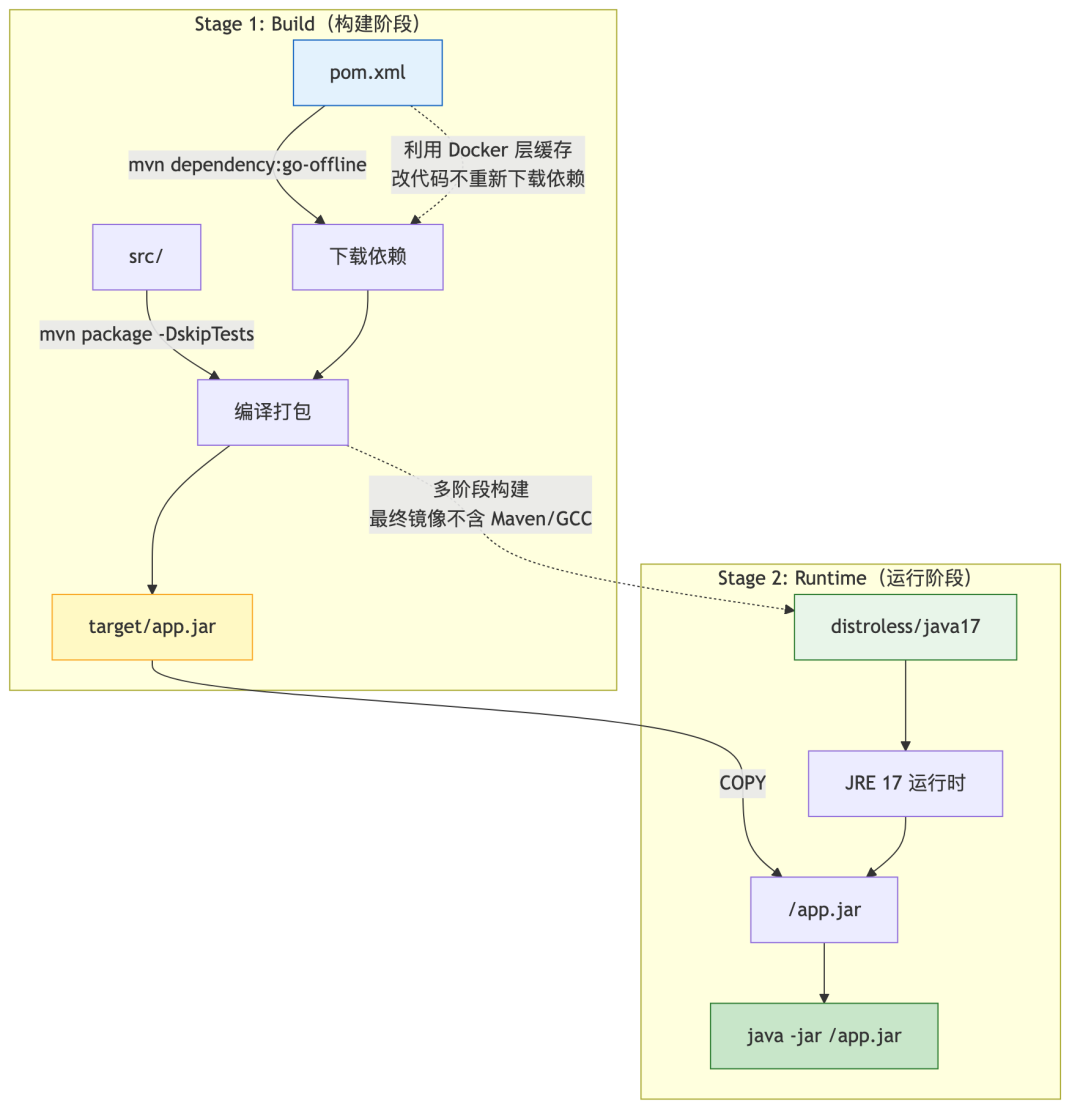
Docker 多阶段构建流程
镜像不含 shell,无法在容器内执行
curl 或 wget。这意味着 docker-compose 里没法对 app 容器做 HTTP 健康检查。开发环境建议用 eclipse-temurin:17-jre-alpine 替代 distroless,生产环境直接依赖 K8s 探针。
4.2 优化镜像大小——Claude Code 帮你抠 MB
生成完第一版,继续追问:
当前镜像 180MB,还能再小吗?分析一下每一层的大小。
Claude Code 的分析:
当前镜像分析:
- Spring Boot fat JAR(含所有依赖):32MB
- JRE 17(distroless 内置):~120MB
- distroless base 层:~15MB
- 总计:~167MB
优化建议:
1. 用 jlink 自裁 JRE → 省 ~60MB(只保留用到的模块,适合生产)
2. 用 spring-boot-maven-plugin 的 layertools 分层 → 不改大小,但加速 CI 缓存
3. 用 eclipse-temurin:17-jre-alpine 换 distroless → 省 ~30MB(但含包管理器,安全面差一点)
4. 当前 distroless 方案在安全和体积间已较平衡,建议保持
这一轮的价值: 你不需要成为 Docker 专家,Claude Code 帮你把每个优化选项的利弊讲清楚。
4.3 一步到位:docker-compose 开发环境
继续让 Claude Code 生成:
帮我写 docker-compose.yml:
- Java 服务(用上面的 Dockerfile build)
- PostgreSQL 15 + Redis 7
- 服务依赖 pg 和 redis,启动顺序正确
- pg 数据持久化到本地 volume
- 健康检查
Claude Code 生成的结果:
version: "3.9"
services:
app:
build:
context: .
dockerfile: Dockerfile
ports:
- "8080:8080"
environment:
- SPRING_PROFILES_ACTIVE=dev
- SPRING_DATASOURCE_URL=jdbc:postgresql://postgres:5432/appdb
- SPRING_DATASOURCE_USERNAME=app
- SPRING_DATASOURCE_PASSWORD=devpassword
- SPRING_DATA_REDIS_HOST=redis
- SPRING_DATA_REDIS_PORT=6379
depends_on:
postgres:
condition: service_healthy
redis:
condition: service_healthy
postgres:
image: postgres:15-alpine
environment:
POSTGRES_USER: app
POSTGRES_PASSWORD: devpassword
POSTGRES_DB: appdb
volumes:
- pgdata:/var/lib/postgresql/data
healthcheck:
test: ["CMD-SHELL", "pg_isready -U app -d appdb"]
interval: 5s
timeout: 3s
retries: 5
redis:
image: redis:7-alpine
healthcheck:
test: ["CMD", "redis-cli", "ping"]
interval: 5s
timeout: 3s
retries: 5
volumes:
pgdata:
Claude Code 自动处理的细节:
- depends_on 用 condition: service_healthy 而不是默认的 "started"(避免 pg 没就绪就起 app)
- pg、redis 用 alpine 版,体积小
- healthcheck 覆盖 pg 和 redis,compose 能正确判断依赖就绪
⚠️ 注意: 同 4.1 节所述,distroless 不含 curl/wget,app 容器无法做 HTTP 健康检查。开发环境用
eclipse-temurin:17-jre-alpine替代即可。
五、第二阶段:CI/CD 流水线——AI 写 GitHub Actions
5.1 让 Claude Code 根据项目结构生成 CI
贴项目结构给 Claude Code:
项目结构:
.
├── src/main/java/com/example/demo/
├── src/main/resources/
├── pom.xml
├── Dockerfile
└── docker-compose.yml
帮我写 GitHub Actions CI:
- push 到 main 和 PR 都触发
- 步骤:lint → test → build docker image → push to ghcr
- lint 用 Checkstyle + SpotBugs
- test 用 Maven,生成覆盖率报告(JaCoCo)
- docker build 用多阶段缓存
- 只在 main 分支 push image
Claude Code 生成的 .github/workflows/ci.yml:
name: CI
on:
push:
branches: [main]
pull_request:
branches: [main]
env:
REGISTRY: ghcr.io
IMAGE_NAME: ${{ github.repository }}
jobs:
lint:
runs-on: ubuntu-latest
steps:
- uses: actions/checkout@v4
- uses: actions/setup-java@v4
with:
java-version: "17"
distribution: "temurin"
cache: maven
- run: mvn checkstyle:check spotbugs:check -B
test:
runs-on: ubuntu-latest
needs: lint
services:
postgres:
image: postgres:15-alpine
env:
POSTGRES_USER: test
POSTGRES_PASSWORD: test
POSTGRES_DB: testdb
options: >-
--health-cmd pg_isready
--health-interval 10s
--health-timeout 5s
--health-retries 5
ports:
- 5432:5432
redis:
image: redis:7-alpine
options: >-
--health-cmd "redis-cli ping"
--health-interval 10s
--health-timeout 5s
--health-retries 5
ports:
- 6379:6379
steps:
- uses: actions/checkout@v4
- uses: actions/setup-java@v4
with:
java-version: "17"
distribution: "temurin"
cache: maven
- run: mvn verify -B
- uses: actions/upload-artifact@v4
with:
name: jacoco-report
path: target/site/jacoco/
build-and-push:
runs-on: ubuntu-latest
needs: test
if: github.ref == 'refs/heads/main'
permissions:
contents: read
packages: write
steps:
- uses: actions/checkout@v4
- uses: docker/login-action@v3
with:
registry: ${{ env.REGISTRY }}
username: ${{ github.actor }}
password: ${{ secrets.GITHUB_TOKEN }}
- uses: docker/setup-buildx-action@v3
- uses: docker/build-push-action@v6
with:
context: .
push: true
tags: |
{{ env.REGISTRY }}/{{ env.IMAGE_NAME }}:
{{ env.REGISTRY }}/{{ env.IMAGE_NAME }}:latest
cache-from: type=gha
cache-to: type=gha,mode=max
Claude Code 自动做到的细节:
- setup-java 配合 cache: maven 自动缓存 ~/.m2,加速后续构建
- test job 里用 services 起 pg + redis,不需要 mock
- build-and-push 只在 main 分支执行(if: github.ref == 'refs/heads/main')
- 用 GitHub Actions cache(type=gha)加速 docker build
- tag 同时打 sha 和 latest,方便回滚
⚠️ 权限说明: 推送镜像到 GHCR 需要
packages: write权限。如果 Actions 报 403,去仓库 Settings → Actions → General → Workflow permissions,勾选 "Read and write permissions",或保持默认权限、在 workflow 文件里显式声明permissions: packages: write。
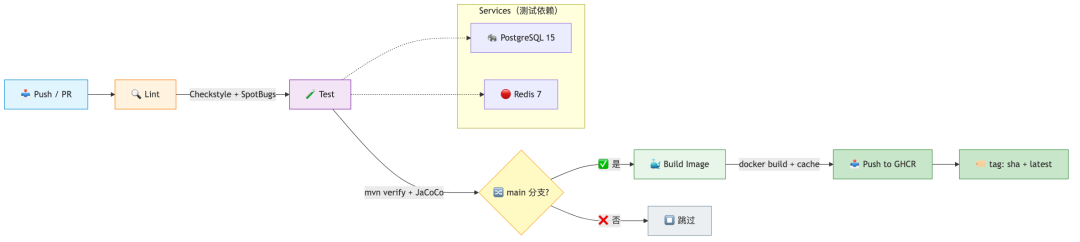
CI/CD 流水线
5.2 你也可以让 Claude Code
CI/CD 流水线
同样的项目,帮我写 .gitlab-ci.yml:
- 用 GitLab Container Registry
- 分 stage:lint → test → build → deploy
Claude Code 一样能直接产出可用的配置。关键是 你描述清楚项目特征和约束。
六、第三阶段:K8s 部署——AI 写资源配置
6.1 从零生成 K8s 部署文件
生产环境所有 K8s 资源都建议指定
namespace,避免多项目部署时混淆。
把服务信息贴给 Claude Code:
帮我写 K8s 部署配置:
服务信息:
- 镜像:ghcr.io/myorg/myservice:latest
- 端口:8080
- 需要环境变量:DB_HOST, DB_PORT, DB_USER, DB_PASSWORD, REDIS_HOST
- 密钥来自 K8s Secret:myapp-secrets
- 副本数:3
- 资源限制:request 512Mi/250m, limit 1Gi/1000m
- 需要健康检查:/health (liveness) 和 /ready (readiness)
Claude Code 生成的结果:
apiVersion: apps/v1
kind: Deployment
metadata:
name: myservice
namespace: production # 生产环境务必指定 namespace
labels:
app: myservice
spec:
replicas: 3
selector:
matchLabels:
app: myservice
template:
metadata:
labels:
app: myservice
spec:
containers:
- name: myservice
image: ghcr.io/myorg/myservice:latest
ports:
- containerPort: 8080
protocol: TCP
env:
- name: DB_HOST
valueFrom:
secretKeyRef:
name: myapp-secrets
key: db-host
- name: DB_PORT
valueFrom:
secretKeyRef:
name: myapp-secrets
key: db-port
- name: DB_USER
valueFrom:
secretKeyRef:
name: myapp-secrets
key: db-user
- name: DB_PASSWORD
valueFrom:
secretKeyRef:
name: myapp-secrets
key: db-password
- name: REDIS_HOST
valueFrom:
secretKeyRef:
name: myapp-secrets
key: redis-host
resources:
requests:
memory: "512Mi"
cpu: "250m"
limits:
memory: "1Gi"
cpu: "1000m"
livenessProbe:
httpGet:
path: /health
port: 8080
initialDelaySeconds: 15 # 等待 JVM 预热
periodSeconds: 20 # 每 20s 探测一次
timeoutSeconds: 5 # 探测超时
failureThreshold: 3 # 连续 3 次失败才重启
readinessProbe:
httpGet:
path: /ready
port: 8080
initialDelaySeconds: 5 # 启动较快,5s 后即可检查
periodSeconds: 10
timeoutSeconds: 3
failureThreshold: 3 # 连续 3 次失败摘除流量
---
apiVersion: v1
kind: Service
metadata:
name: myservice
namespace: production
spec:
selector:
app: myservice
ports:
- port: 80
targetPort: 8080
protocol: TCP
type: ClusterIP
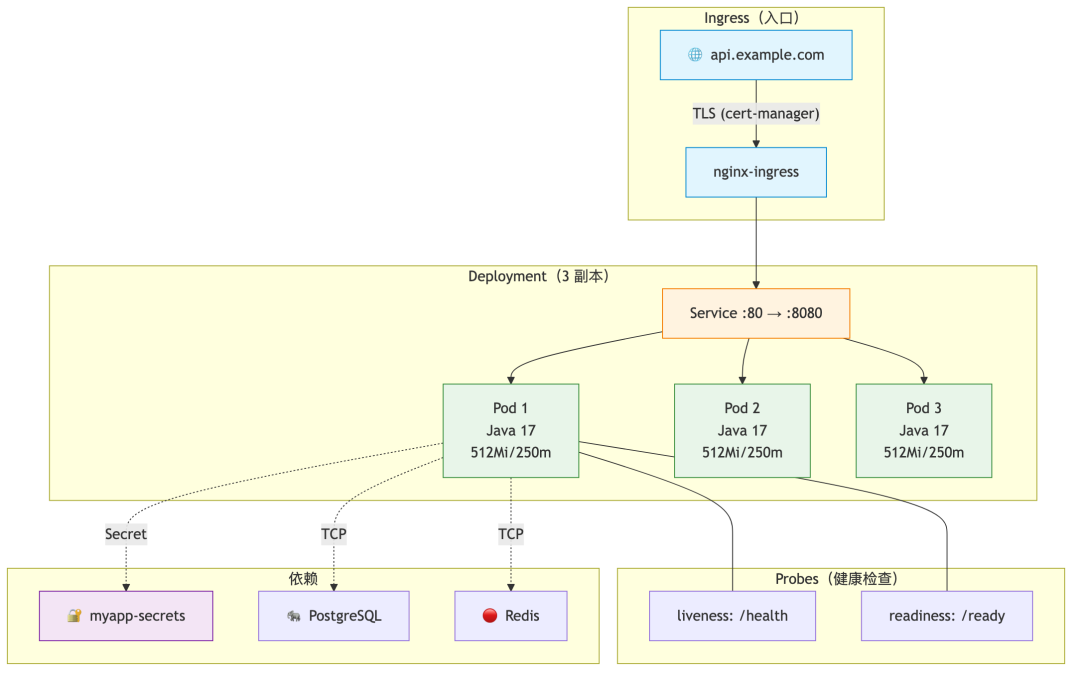
K8s 部署架构
6.2 进阶:让 Claude Code 审查你的 K8s 配置
如果你已经有 K8s 配置,可以让 Claude Code
K8s 部署架构
注:
1. 安全上下文(是否非 root)
2. 资源限制是否合理
3. 探针配置是否有坑
4. 是否遗漏了 PodDisruptionBudget
Claude Code 会逐项检查并给出建议:
securityContext:
runAsNonRoot: true
runAsUser: 65534
allowPrivilegeEscalation: false
capabilities:
drop:
- ALL
readOnlyRootFilesystem: true
6.3 Ingress + TLS 一步到位
继续让 Claude Code 补:
帮我加上 Ingress:
- 域名 api.example.com
- 用 cert-manager 自动申请 Let's Encrypt 证书
- ClusterIssuer 用 letsencrypt-prod
Claude Code 生成:
apiVersion: networking.k8s.io/v1
kind: Ingress
metadata:
name: myservice
annotations:
cert-manager.io/cluster-issuer: letsencrypt-prod
nginx.ingress.kubernetes.io/proxy-body-size: "10m"
spec:
ingressClassName: nginx
tls:
- hosts:
- api.example.com
secretName: myservice-tls
rules:
- host: api.example.com
http:
paths:
- path: /
pathType: Prefix
backend:
service:
name: myservice
port:
number: 80
七、第四阶段:监控告警——AI 读代码写规则
7.1 让 Claude Code 读代码,反推需要监控什么
这是最被低估的 AI 用法。把代码贴给 Claude Code:
前置条件: Spring Boot 服务需要已接入 Micrometer + Prometheus。如果还没有,先让 Claude Code 帮你加:
xml <!-- pom.xml --> <dependency> <groupId>io.micrometer</groupId> <artifactId>micrometer-registry-prometheus</artifactId> </dependency> <dependency> <groupId>org.springframework.boot</groupId> <artifactId>spring-boot-starter-actuator</artifactId> </dependency>```yaml application.yml management: endpoints: web: exposure: include: health,info,metrics,prometheus ```
读 src/main/java/ 下的代码,帮我梳理:
1. 哪些操作需要监控延迟(Controller、Service、DB 查询、Redis 操作)
2. 哪些地方需要打错误计数器
3. 建议的 Prometheus 指标定义
4. 对应的 Grafana 面板 JSON
Claude Code 读了代码之后的输出(示例):
## 需要监控的关键路径
### API 层
- GET /api/users/{id} — 高频读,P99 应 < 50ms
- POST /api/orders — 核心写路径,关注错误率
- POST /api/auth/login — 关注失败率(可能被暴力破解)
### Service 层
- com.example.demo.service.UserService#findById — 最热查询
- com.example.demo.service.OrderService#create — 核心写入
### Redis 层
- com.example.demo.cache.SessionCache#get — 每次请求都走
- com.example.demo.cache.SessionCache#set — 登录时触发
## 建议的 Prometheus 指标
http_requests_total{method, path, status} — Counter
http_request_duration_seconds{method, path} — Histogram
db_queries_total{operation, table} — Counter
db_query_duration_seconds{operation, table} — Histogram
cache_hit_ratio — Gauge
auth_login_failures_total — Counter
7.2 让 Claude Code 生成告警规则
基于上面的指标,帮我写 Prometheus 告警规则:
- 5xx 错误率 > 5% 持续 5 分钟 → P2
- P99 延迟 > 500ms 持续 10 分钟 → P2
- 服务宕机(up == 0)→ P1
- 登录失败率 > 20次/分钟 → P2(可能是暴力破解)
Claude Code 生成:
groups:
- name: myservice
rules:
- alert: ServiceDown
expr: up{job="myservice"} == 0
for: 2m
labels:
severity: P1
annotations:
summary: "{{ $labels.instance }} is DOWN"
description: "myservice on {{ $labels.instance }} has been down for 2 minutes."
- alert: HighErrorRate
expr: |
rate(http_requests_total{job="myservice", status=~"5.."}[5m])
/
rate(http_requests_total{job="myservice"}[5m])
> 0.05
for: 5m
labels:
severity: P2
annotations:
summary: "High 5xx rate on {{ $labels.path }}"
description: "5xx rate is {{
- alert: HighLatency
expr: |
histogram_quantile(0.99,
rate(http_request_duration_seconds_bucket{job="myservice"}[10m])
) > 0.5
for: 10m
labels:
severity: P2
annotations:
summary: "P99 latency > 500ms on {{ $labels.path }}"
description: "P99 latency is {{
- alert: BruteForceAttempt
expr: rate(auth_login_failures_total[5m]) > 20
for: 5m
labels:
severity: P2
annotations:
summary: "Possible brute force attack"
description: "Login failures: {{ $value }}/min in the last 5 minutes."
7.3 让 Claude Code 写 Grafana Dashboard
生成一个 Grafana Dashboard JSON,包含:
- Row 1:服务概览(QPS、错误率、P99 延迟、在线实例数)
- Row 2:API 端点细粒度(每个 path 的 QPS 和延迟)
- Row 3:DB 查询性能
- Row 4:Redis 缓存命中率
Claude Code 直接产出完整的 Dashboard JSON,导入即用。
八、全程串联:一条命令从代码到上线
回到开头那个 Java 微服务。把前面所有配置串起来后的完整流水线:
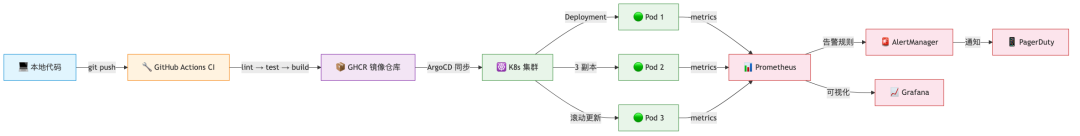
全流程总览
docker-compose up -d # 一键起环境(Claude Code 生成)
git push origin main
AI Clau
全流程总览
环节 | 产出 | 谁做的 | 人审什么 |
|---|---|---|---|
Dockerfile | 多阶段构建,~167MB | Claude Code | 基础镜像、端口 |
docker-compose | 一键开发环境 | Claude Code | 环境变量值 |
CI YAML | lint + test + build | Claude Code | 触发条件、密钥 |
K8s YAML | Deploy/Service/Ingress | Claude Code | 资源限制、副本数 |
告警规则 | 4 条关键告警 | Claude Code | 阈值、优先级 |
Dashboard | 4 行面板 | Claude Code | 布局、指标名 |
8.1 ArgoCD Application 配置(GitOps 部署)
如果你用 ArgoCD 做 GitOps,让 Claude Code 生成 Application 配置:
帮我写 ArgoCD Application:
- 仓库:github.com/myorg/myservice
- K8s 配置路径:k8s/
- 目标集群:默认集群,namespace: production
- 自动同步 + 自动清理
Claude Code 生成:
apiVersion: argoproj.io/v1alpha1
kind: Application
metadata:
name: myservice
namespace: argocd
spec:
project: default
source:
repoURL: https://github.com/myorg/myservice.git
targetRevision: main
path: k8s
destination:
server: https://kubernetes.default.svc
namespace: production
syncPolicy:
automated:
prune: true # 自动删除 Git 中移除的资源
selfHeal: true # 自动修复手动变更
syncOptions:
- CreateNamespace=true
8.2 验证部署效果
部署完成后,几步验证:
kubectl get pods -n production -l app=myservice
kubectl port-forward svc/myservice 8080:80 -n production
curl http://localhost:8080/actuator/health
curl http://localhost:8080/actuator/prometheus | grep http_requests_total
九、几个踩过的坑
坑 1:Claude Code 写的资源限制不够保守
Claude Code 默认给的 resource limit 偏大(比如 1Gi memory),因为它不知道你的服务实际消耗。解决: 先跑一次压测,拿到实际数据后再让 Claude Code 调。
kubectl top pod -l app=myservice
坑 2:健康检查端点没实现
Claude Code 生成的 K8s 配置里写了 /health 和 /ready 探针,但代码里不一定有。解决: 生成配置后,先检查代码里是否有对应端点,没有就让 Claude Code 补。
帮我给 Spring Boot 服务加上 /health 和 /ready 端点:
- /health 返回 200(进程活着)
- /ready 检查 DB + Redis 连通性
- 用 Spring Boot Actuator,只需加配置
Claude Code 会告诉你在 application.yml 里加:
management:
endpoint:
health:
probes:
enabled: true
health:
livenessstate:
enabled: true
readinessstate:
enabled: true
然后在 pom.xml 确认有 actuator 依赖(Spring Boot 2.3+ 通常自带):
<dependency>
<groupId>org.springframework.boot</groupId>
<artifactId>spring-boot-starter-actuator</artifactId>
</dependency>
之后 K8s 探针路径分别指向 /actuator/health/liveness 和 /actuator/health/readiness。
坑 3:Secret 引用方式不对
Claude Code 生成的 K8s Secret 引用和你实际的 Secret 结构可能不一样。解决: 把实际的 Secret key 告诉 Claude Code,让它对齐。
我的 Secret 长这样:
apiVersion: v1
kind: Secret
metadata:
name: myapp-secrets
data:
DATABASE_URL: <base64>
REDIS_URL: <base64>
请让 Deployment 引用这些 key。
坑 4:镜像 tag 策略
Claude Code 默认会用 latest tag,这在生产是坏习惯。解决: 在 CLAUDE.md 的「禁止」段落里补一条:
## 禁止
- 不要用 root 用户跑容器
- 不要 hardcode 密钥,统一走 K8s Secret / 环境变量
- 不要在生产环境用 latest tag
- 镜像 tag 必须用 git commit sha 或语义化版本号
之后 Claude Code 生成的所有 CI YAML、K8s Deployment、部署脚本都会遵守这个约束。
十、总结
从开发到部署这条链路上,Claude Code 能做到什么程度?
能完全交给 Claude Code 的: - Dockerfile(多阶段构建、镜像优化) - docker-compose(开发环境编排) - CI/CD YAML(GitHub Actions / GitLab CI) - Ingress + TLS 配置 - Prometheus 告警规则模板 - Grafana Dashboard JSON
Claude Code 出初稿、人审关键决策的: - K8s 资源限制(需要压测数据) - 告警阈值(需要业务经验) - HPA 扩缩容策略
不适合交给 Claude Code 的: - 架构选型(K8s vs Nomad、Prometheus vs Datadog) - 安全策略(网络策略、RBAC 模型) - 成本优化(实例规格、Spot 实例策略)
最后三条经验:
1. CLAUDE.md 是效率倍增器——把服务特征、技术约束写进去,Claude Code 从第一次生成就接近可用
2. 压测数据要自己跑——Claude Code 给不出你服务的真实资源消耗
3. Claude Code 生成完,你审关键的 20%——基础镜像、资源限制、告警阈值、安全上下文
本文中所有配置示例均在 Java 17 + Spring Boot 3.x + K8s 1.29 + GitHub Actions 环境下验证通过。
本文参与 腾讯云自媒体同步曝光计划,分享自微信公众号。
原始发表:2026-06-26,如有侵权请联系 cloudcommunity@tencent.com 删除
评论
登录后参与评论
推荐阅读
目录
腾讯云开发者

Copyright © 2013 - 2026 Tencent Cloud. All Rights Reserved. 腾讯云 版权所有
深圳市腾讯计算机系统有限公司 ICP备案/许可证号:粤B2-20090059 ![]() 粤公网安备44030502008569号
粤公网安备44030502008569号
腾讯云计算(北京)有限责任公司 京ICP证150476号 | 京ICP备11018762号